OPEN-SOURCE SCRIPT
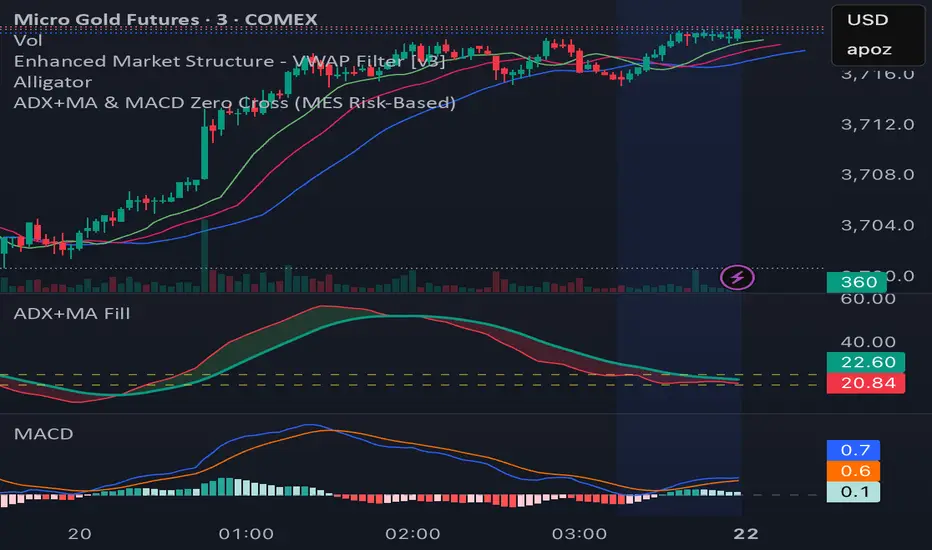
Average Directional Index + MA (with Fill trend color)

Description
This indicator combines the Average Directional Index (ADX) with a configurable moving average (SMA, EMA, RMA, or WMA) and visual fill. It helps traders assess the strength of a trend by highlighting when ADX is above or below its moving average.
When ADX is rising above the MA, it suggests strengthening momentum; when falling below, it indicates weakening momentum. The dynamic green/red fill makes these transitions easy to spot.
Horizontal threshold levels at 20 and 25 are included as key references:
Below 20 → often signals ranging or sideways/consolidation markets.
Crossing above 20 or 25 → may suggest the beginning of a breakout or trend, useful for trend-following strategies.
How to use
Filter out sideways/consolidation phases and focus on breakout or trend-following opportunities when price action coincides with ADX crossing above the 20/25 thresholds.
Customization
ADX length & smoothing.
Moving average type and length.
Adjustable fill transparency.
Optional threshold lines at 20 and 25.
Open-source script
In true TradingView spirit, the creator of this script has made it open-source, so that traders can review and verify its functionality. Kudos to the author! While you can use it for free, remember that republishing the code is subject to our House Rules.
Disclaimer
The information and publications are not meant to be, and do not constitute, financial, investment, trading, or other types of advice or recommendations supplied or endorsed by TradingView. Read more in the Terms of Use.