BITCOINDICATOR Range Finder
Eliminates the need to manually draw trend lines and add price labels.
How to use:
Adjust the "Draw support/resistance from how many bars back" inputs to find an accurate trading range according to your timeframe and trading strategy.
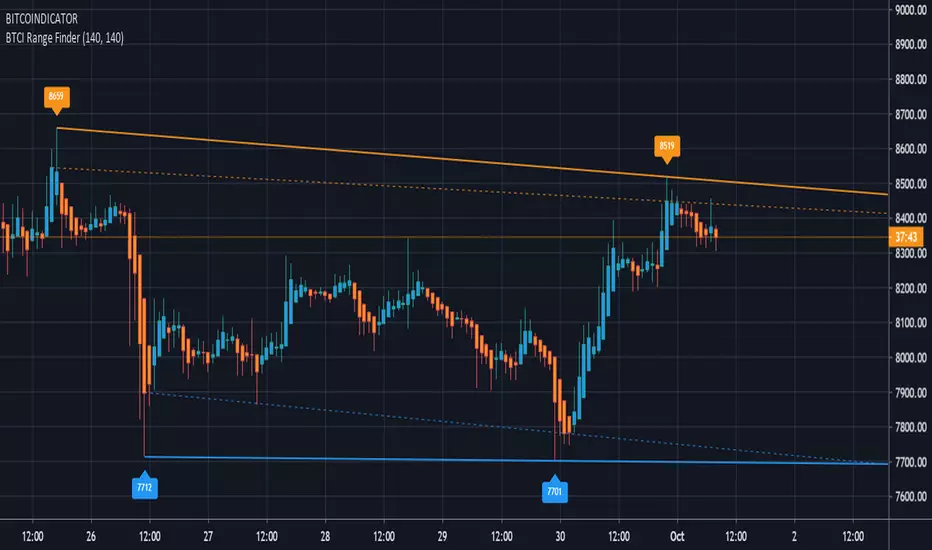
Example (chart above): Bars back values are both set to 140. The left resistance label "8659" targets the "high" of the upper half of the bars back input (71-140). The right resistance label "8519" targets the "high" of the lower half of the input (0-70). The supports work the same way but target the "lows".
The dotted lines are drawn from the two "highest closes" (resistance) and the two "lowest closes" (support) over the same input range and can be used to create support & resistance zones.
Side note: the colored bars come from the BITCOINDICATOR indicator with the labels and symbols removed.
This indicator works for ANY chart and all markets.
*The Bitcoindicator Range Finder is part of the Bitcoindicator package.
For detailed information on Bitcoindicator and how to add it to your charts, please visit:
https://www.bitcoindicator.com
Invite-only script
Only users approved by the author can access this script. You'll need to request and get permission to use it. This is typically granted after payment. For more details, follow the author's instructions below or contact IndicatorKing directly.
TradingView does NOT recommend paying for or using a script unless you fully trust its author and understand how it works. You may also find free, open-source alternatives in our community scripts.
Author's instructions
Disclaimer
Invite-only script
Only users approved by the author can access this script. You'll need to request and get permission to use it. This is typically granted after payment. For more details, follow the author's instructions below or contact IndicatorKing directly.
TradingView does NOT recommend paying for or using a script unless you fully trust its author and understand how it works. You may also find free, open-source alternatives in our community scripts.