OPEN-SOURCE SCRIPT
Updated EMA Smoothed Standard Error Bands-zrbb-
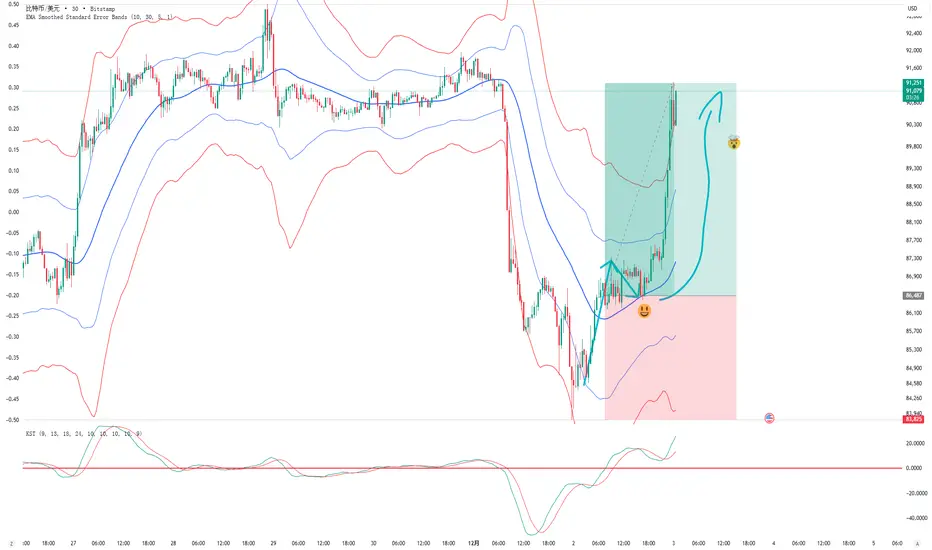
EMA Smoothed Standard Error Bands-zrbb-
The Standard Error Bands (SEM) indicator is primarily used in market analysis to measure price volatility, assess trend strength, and identify potential market reversals or consolidation zones. Similar to Bollinger Bands, it is typically based on linear regression lines rather than simple moving averages, providing traders with a visual range of price fluctuations around its average trend.
Specific functions include:
* Measuring Volatility: The width of the SEM directly reflects market volatility. When price trends are stable, the bandwidth typically contracts, indicating that data points are clustered around the mean; conversely, when market volatility increases, the bandwidth expands, indicating greater price dispersion.
* Assessing Trend Strength and Direction: This indicator can show the direction of the current trend and assess its strength by observing the price's position within the bands. If the price consistently touches or trades near the boundary on one side of the band, it usually indicates a strong trend in that direction.
* Identifying Overbought/Oversold Signals: While not a strictly overbought/oversold indicator, when the price touches or breaks through the upper or lower band, it may indicate that the market is in a state of extreme volatility in the short term, potentially leading to a price pullback or reversal.
Predicting Potential Trend Ends or Consolidation: When the standard error band begins to expand significantly, it can be a signal that the momentum of the current trend is weakening, and the market may be about to enter a consolidation phase or the trend may be about to reverse.
Assisting Decision Making and Risk Management: Traders use the boundary lines as potential support and resistance levels to help determine entry and exit points or set stop-loss levels, thereby managing trading risk.
In summary, the standard error band is a dynamic volatility tool that helps traders better understand market behavior by quantifying the degree to which prices deviate from their predicted trend, providing an important reference, especially in judging the continuation of trends and potential turning points.
标准误差带(Standard Error Bands)指标在市场分析中主要用于衡量价格波动性、判断趋势强度以及识别潜在的市场反转或盘整区域。它类似于布林带(Bollinger Bands),但通常基于线性回归线而不是简单的移动平均线,为交易者提供了价格围绕其平均趋势波动的视觉范围。
具体作用包括:
衡量波动性:标准误差带的宽度直接反映了市场的波动性。当价格趋势稳定时,带宽通常会收缩,表明数据点聚集在均值附近;相反,当市场波动加剧时,带宽会扩张,表明价格离散程度增大。
判断趋势强度和方向:该指标可以显示当前趋势的方向,并通过观察价格在带内的位置来评估趋势的强度。如果价格持续触及或运行在某一侧的边界附近,通常意味着该方向的趋势强劲。
识别超买/超卖信号:虽然不是严格意义上的超买/超卖指标,但当价格触及或突破上轨或下轨时,可能预示着市场短期内处于极端的波动状态,可能会出现价格回调或反转。
预测潜在的趋势结束或盘整:当标准误差带开始显著扩张时,这可能是一个信号,表明当前趋势的动能正在减弱,市场可能即将进入盘整期或趋势即将反转。
辅助决策和风险管理:交易者利用边界线作为潜在的支撑位和阻力位,帮助确定进场、出场点位或设置止损水平,从而管理交易风险。
总之,标准误差带是一个动态的波动率工具,它通过量化价格偏离其预测趋势的程度,帮助交易者更清晰地理解市场行为,尤其是在判断趋势的持续性和潜在转折点方面提供了重要参考。
Release Notes
The parameters have been updated, making it more convenient to use directly.Open-source script
In true TradingView spirit, the creator of this script has made it open-source, so that traders can review and verify its functionality. Kudos to the author! While you can use it for free, remember that republishing the code is subject to our House Rules.
Disclaimer
The information and publications are not meant to be, and do not constitute, financial, investment, trading, or other types of advice or recommendations supplied or endorsed by TradingView. Read more in the Terms of Use.
Open-source script
In true TradingView spirit, the creator of this script has made it open-source, so that traders can review and verify its functionality. Kudos to the author! While you can use it for free, remember that republishing the code is subject to our House Rules.
Disclaimer
The information and publications are not meant to be, and do not constitute, financial, investment, trading, or other types of advice or recommendations supplied or endorsed by TradingView. Read more in the Terms of Use.