PROTECTED SOURCE SCRIPT
Updated Wolf Alerts Signals

Wolf Alerts Signals
This is an indicator of possible market entry.
Indicates with an arrow the direction and with a letter the intensity ("H" High or "L" Low).
Everything is calculated by comparing RSI and Volumes.
produced by zstiziano
This is an indicator of possible market entry.
Indicates with an arrow the direction and with a letter the intensity ("H" High or "L" Low).
Everything is calculated by comparing RSI and Volumes.
produced by zstiziano
Release Notes
Adjustment of short values.Release Notes
Update Release Notes
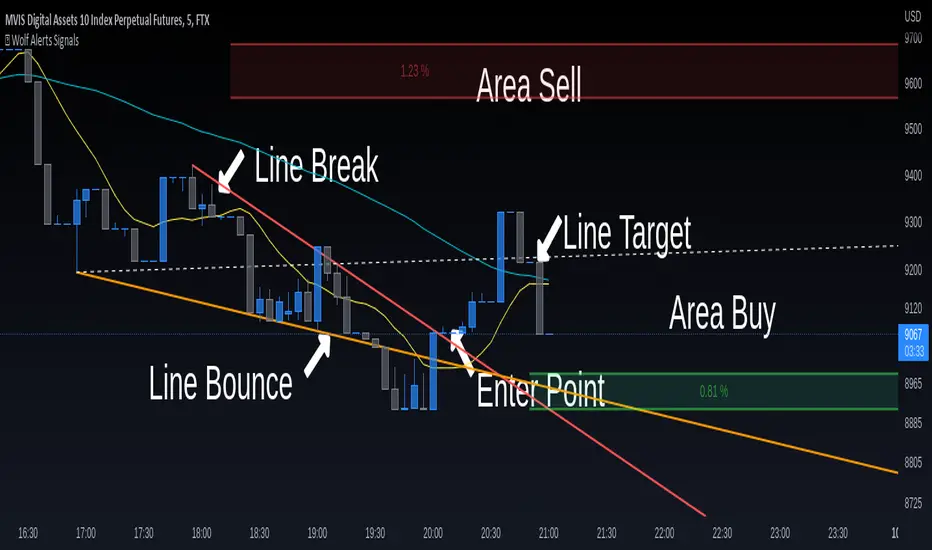
This indicator helps you find:- trend direction thanks to 3 moving averages
- breaking points of the trend lines
- buying and selling areas with the highest trade
- signals of too much sold or too much bought
Help this project with a small donation:
https://www.paypal.com/donate/?hosted_button_id=XFWT7XME5DRFE
Release Notes
EXAMPLE LONG
EXAMPLE SHORT
▬▬▬▬▬▬▬▬▬▬▬▬▬▬▬▬▬▬▬▬▬▬▬▬▬▬▬▬▬▬▬▬▬▬▬
SUPPORT THIS PROJECT
▬▬▬▬▬▬▬▬▬▬▬▬▬▬▬▬▬▬▬▬▬▬▬▬▬▬▬▬▬▬▬▬▬▬▬
💰 [url= paypal.com/donate/?hosted_button_id=XFWT7XME5DRFE ] paypal.com/donate/?hosted_button_id=XFWT7XME5DRFE 💰
Release Notes
fix bugRelease Notes
- fix trend line- add line target
▬▬▬▬▬▬▬▬▬▬▬▬▬▬▬▬▬▬▬▬▬▬▬▬▬▬▬▬▬▬▬▬▬▬▬
SUPPORT THIS PROJECT
💰 DONATE WITH PAYPAL 💰
[url= paypal.com/donate/?hosted_button_id=XFWT7XME5DRFE ] paypal.com/donate/?hosted_button_id=XFWT7XME5DRFE ▬▬▬▬▬▬▬▬▬▬▬▬▬▬▬▬▬▬▬▬▬▬▬▬▬▬▬▬▬▬▬▬▬▬▬
Release Notes
- added the possibility to choose whether to consider the shadow or not
Protected script
This script is published as closed-source. However, you can use it freely and without any limitations – learn more here.
Disclaimer
The information and publications are not meant to be, and do not constitute, financial, investment, trading, or other types of advice or recommendations supplied or endorsed by TradingView. Read more in the Terms of Use.