OPEN-SOURCE SCRIPT
Updated Flat Numbers
Customizable Price Range: Set the start price and end price to define the range in which horizontal lines will be plotted.
Line Color: Choose the color of the horizontal lines to match your chart's theme or personal preference.
Line Width: Adjust the width of the lines (from 1 to 5) to control their visibility.
Price Step Size: By default, the script plots lines every 100 price units within the range, but this step size can be customized if desired.
Dynamic Line Plotting: The script automatically calculates the number of lines needed and plots them at each interval between the start and end prices.
Release Notes
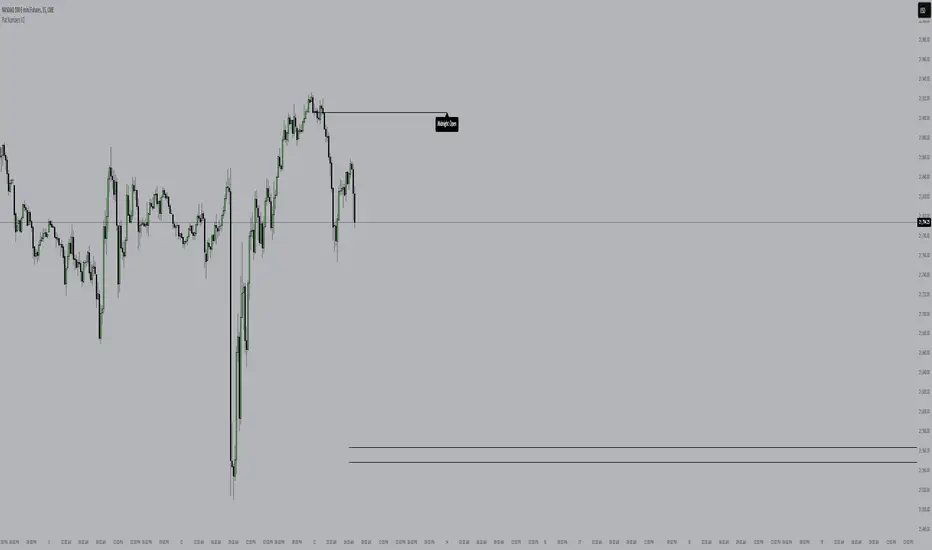
This script draws two lines on a chart:1. **Price Range Lines**: It lets you define a start and end price, then draws horizontal lines at every 100 price units in between.
2. **Opening Lines**: It draws two lines:
- One for the **Midnight Open** (00:00 NY time)
- One for the **08:30 Open** (NY time)
You can customize the color, style, and width of these lines, and optionally add labels showing "Midnight Open" or "08:30 Open". You can also choose the timezone.
In short: It helps visualize key price levels (range) and opening times with customizable lines and labels.
Release Notes
added 830am range Open-source script
In true TradingView spirit, the creator of this script has made it open-source, so that traders can review and verify its functionality. Kudos to the author! While you can use it for free, remember that republishing the code is subject to our House Rules.
Disclaimer
The information and publications are not meant to be, and do not constitute, financial, investment, trading, or other types of advice or recommendations supplied or endorsed by TradingView. Read more in the Terms of Use.
Open-source script
In true TradingView spirit, the creator of this script has made it open-source, so that traders can review and verify its functionality. Kudos to the author! While you can use it for free, remember that republishing the code is subject to our House Rules.
Disclaimer
The information and publications are not meant to be, and do not constitute, financial, investment, trading, or other types of advice or recommendations supplied or endorsed by TradingView. Read more in the Terms of Use.