OPEN-SOURCE SCRIPT
OPR DAX 09:00–09:15 → 11:00 Nico V
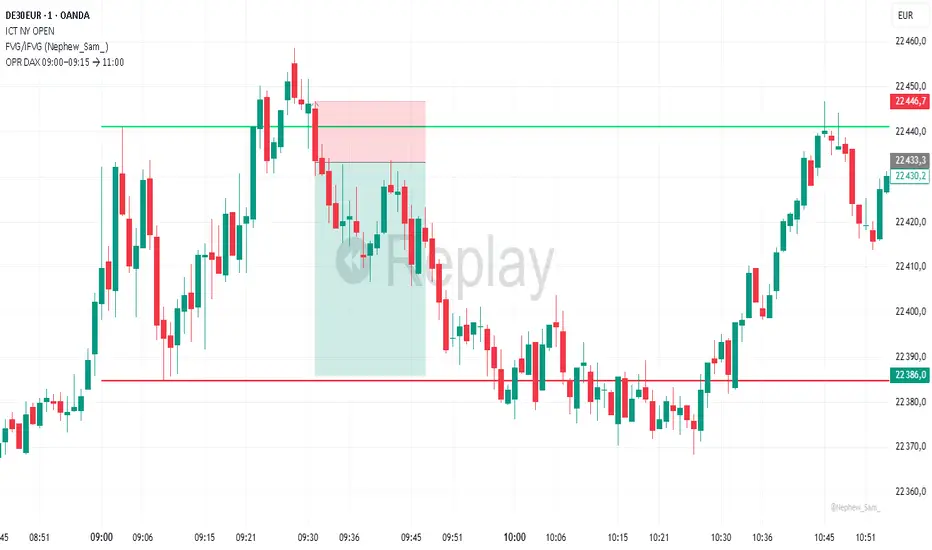
This indicator plots on the DAX each day:
The high (green) and low (red) of the 09:00 → 09:15 Berlin time range.
These levels are extended horizontally until 11:00.
Optionally, it displays the midpoint as a white dashed line.
Purpose: to quickly identify the morning opening range (OPR) and observe how price reacts to these levels during the rest of the morning.
Open-source script
In true TradingView spirit, the creator of this script has made it open-source, so that traders can review and verify its functionality. Kudos to the author! While you can use it for free, remember that republishing the code is subject to our House Rules.
Disclaimer
The information and publications are not meant to be, and do not constitute, financial, investment, trading, or other types of advice or recommendations supplied or endorsed by TradingView. Read more in the Terms of Use.