OPEN-SOURCE SCRIPT
Tradytics Levels with EMA Cloud
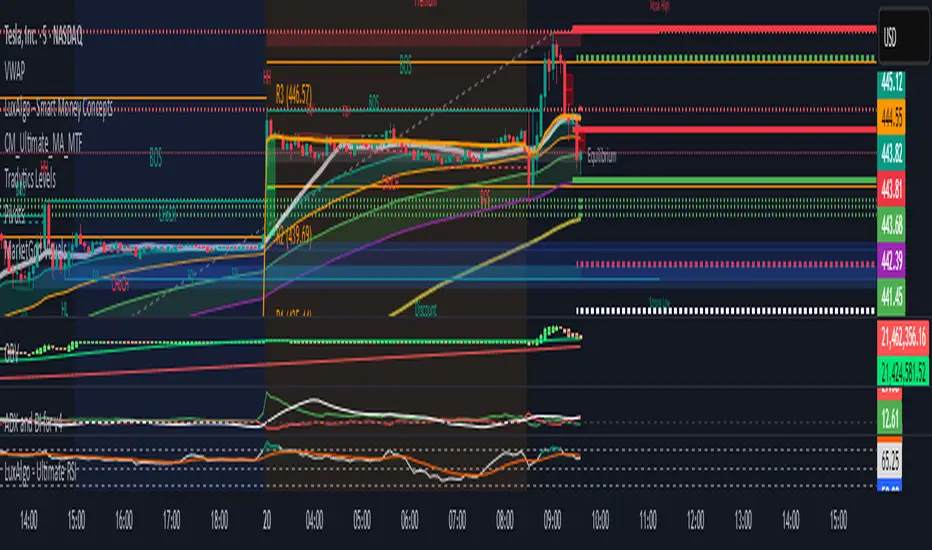
This indicator has tradytics price chart levels where you can put in the input code seen below.
The code has positive gamma (green lines), negative gamma (Red lines) and white dotted line are the darkpool levels.
This is Amazon's 5 minute from Sep30th to October 20th Gammas and weekly Darkpool levels. Just copy and paste code below in the input code and the chart would show the levels.
212.8*1*neutral 220.07*1*neutral 216.038*1*neutral 215.57*1*neutral 219.988*1*neutral 217.401*1*neutral 217.351*1*neutral 212.815*1*neutral 212.75*1*neutral 212.4*1*neutral 215*0*negative 222.5*0*positive 217.5*0*positive 220*0*positive
Open-source script
In true TradingView spirit, the creator of this script has made it open-source, so that traders can review and verify its functionality. Kudos to the author! While you can use it for free, remember that republishing the code is subject to our House Rules.
Disclaimer
The information and publications are not meant to be, and do not constitute, financial, investment, trading, or other types of advice or recommendations supplied or endorsed by TradingView. Read more in the Terms of Use.