OPEN-SOURCE SCRIPT
Volume Density
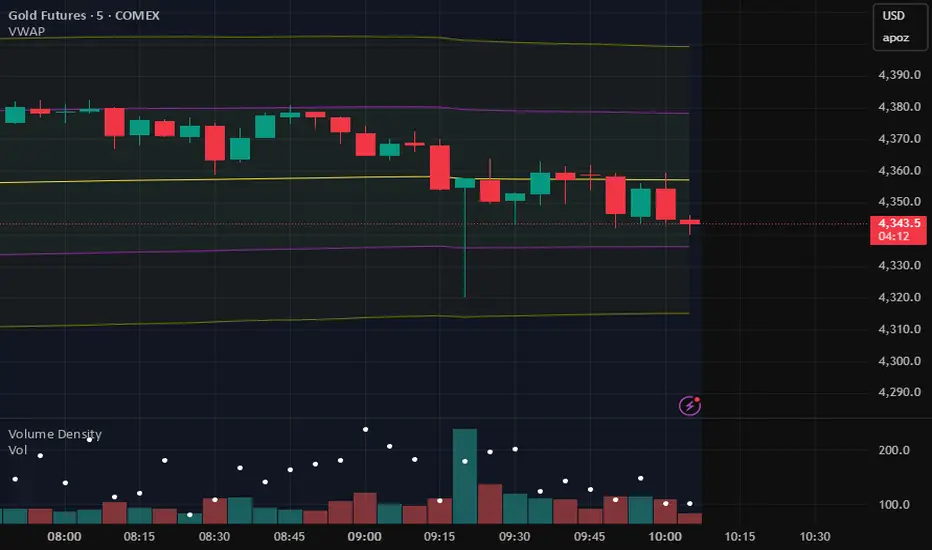
This indicator calculates the volume density of each bar by dividing the trading volume by the bar's price range (high - low). It highlights bars with higher activity relative to their price movement. Density bars are colored teal if the close is higher than the open, and red if the close is lower. Zero-range bars are ignored to prevent division errors.
Open-source script
In true TradingView spirit, the creator of this script has made it open-source, so that traders can review and verify its functionality. Kudos to the author! While you can use it for free, remember that republishing the code is subject to our House Rules.
Disclaimer
The information and publications are not meant to be, and do not constitute, financial, investment, trading, or other types of advice or recommendations supplied or endorsed by TradingView. Read more in the Terms of Use.