OPEN-SOURCE SCRIPT
Stock Highs Tracker
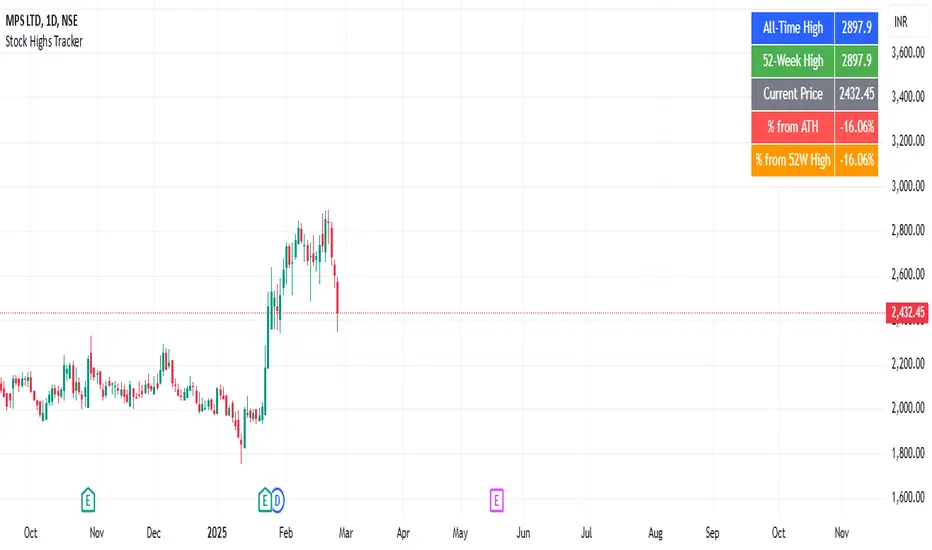
This indicator tracks key stock price levels including the all-time high (ATH), 52-week high, and current price.
It calculates the percentage difference of the current price from both the ATH and 52-week high.
The data is displayed in a table at the top-right corner of the chart, allowing traders to quickly assess the stock’s performance relative to its historical highs.
This is useful for identifying stocks trading near their highs or experiencing significant pullbacks.
Open-source script
In true TradingView spirit, the creator of this script has made it open-source, so that traders can review and verify its functionality. Kudos to the author! While you can use it for free, remember that republishing the code is subject to our House Rules.
Disclaimer
The information and publications are not meant to be, and do not constitute, financial, investment, trading, or other types of advice or recommendations supplied or endorsed by TradingView. Read more in the Terms of Use.