OPEN-SOURCE SCRIPT
Updated MA EMA RSI
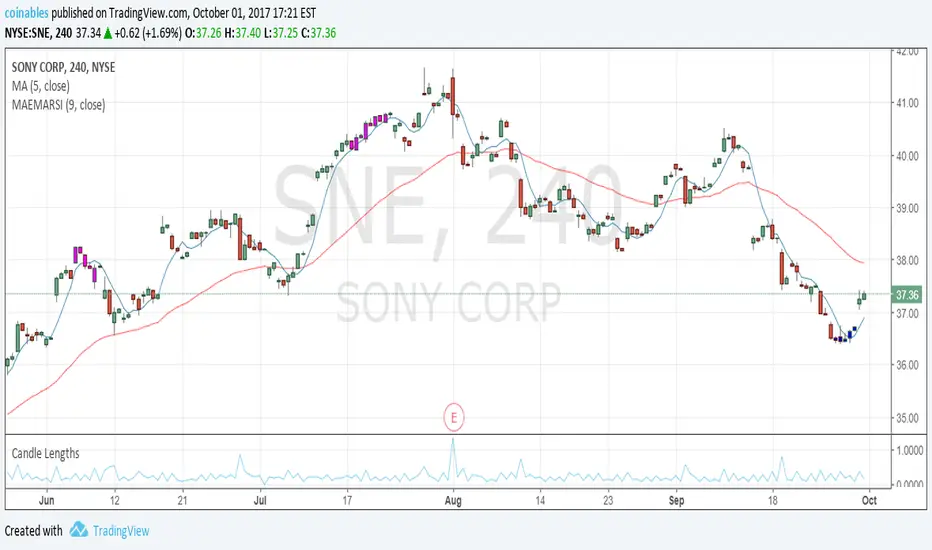
Combining EMA and MA over-extension with RSI to help narrow down overbought and oversold opportunities.
Release Notes
This is a MA EMA RSI combo indicator to help narrow down when markets are really overbought or oversold. The SMA must deviate from the EMA by a certain percentage and the RSI must be greater than or less than a desired level before a candle is colored to indicate a buy(blue) or a sell(pink). Release Notes
Added to allow custom parameter inputs from the userOpen-source script
In true TradingView spirit, the creator of this script has made it open-source, so that traders can review and verify its functionality. Kudos to the author! While you can use it for free, remember that republishing the code is subject to our House Rules.
Disclaimer
The information and publications are not meant to be, and do not constitute, financial, investment, trading, or other types of advice or recommendations supplied or endorsed by TradingView. Read more in the Terms of Use.
Open-source script
In true TradingView spirit, the creator of this script has made it open-source, so that traders can review and verify its functionality. Kudos to the author! While you can use it for free, remember that republishing the code is subject to our House Rules.
Disclaimer
The information and publications are not meant to be, and do not constitute, financial, investment, trading, or other types of advice or recommendations supplied or endorsed by TradingView. Read more in the Terms of Use.