OPEN-SOURCE SCRIPT
Updated Gap Zones

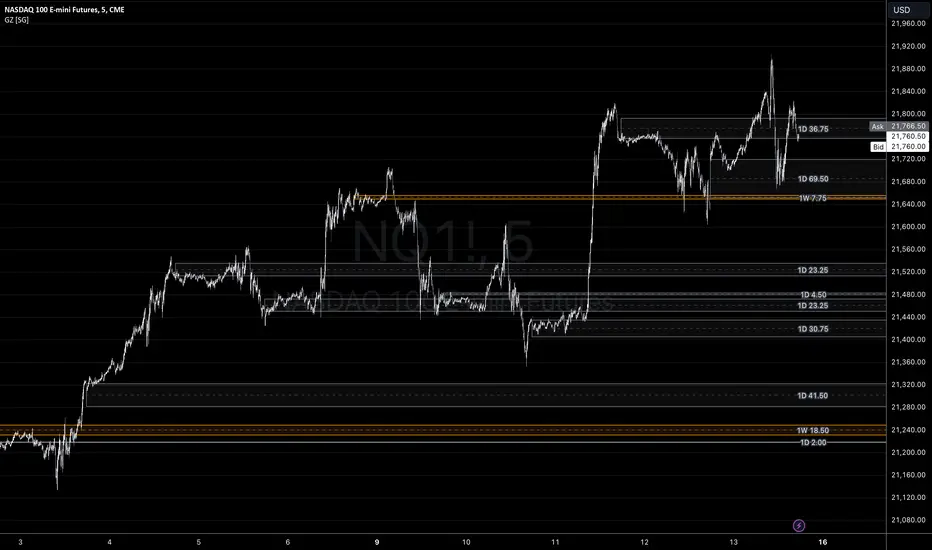
Sharing a simple gap zone identifier, simply detects gap up/down areas and plots them for visual reference. Calculation uses new candle open compared to previous candle close and draws the zone, a mid point is plotted also as far too often it's significance is proven effective.
Works on any timeframe and market though I recommend utilizing timeframes such as weekly or daily for viewing at lower timeframes such as 5, 15 or 30 minutes.
Often price is observed reaching towards zone high/mid/low before rejection/bouncing. These gap zones can give quantitative basis for trade management.
Future features may include alerts based on price crossing up/down gap low, mid and highs. Feel free to message with any other suggestions.
Release Notes
- Simplified color settings
Release Notes
Big update for gap zone users for the final weeks of 2024 :)Adjustments:
- Code rewrite to support multiple timeframes
- Cross timeframe overlap detection
- Better label placement
It shouldn't be necessary to run multiple instances of this indicator to see day, week and month gaps simultaneously and now if on a Monday there's a new week and day gap it'll just print the week gap given the daily gap would be exact same size.
Open-source script
In true TradingView spirit, the creator of this script has made it open-source, so that traders can review and verify its functionality. Kudos to the author! While you can use it for free, remember that republishing the code is subject to our House Rules.
@tradeseekers (YouTube, Twitter)
Disclaimer
The information and publications are not meant to be, and do not constitute, financial, investment, trading, or other types of advice or recommendations supplied or endorsed by TradingView. Read more in the Terms of Use.