Liquidity Hunt Indicator
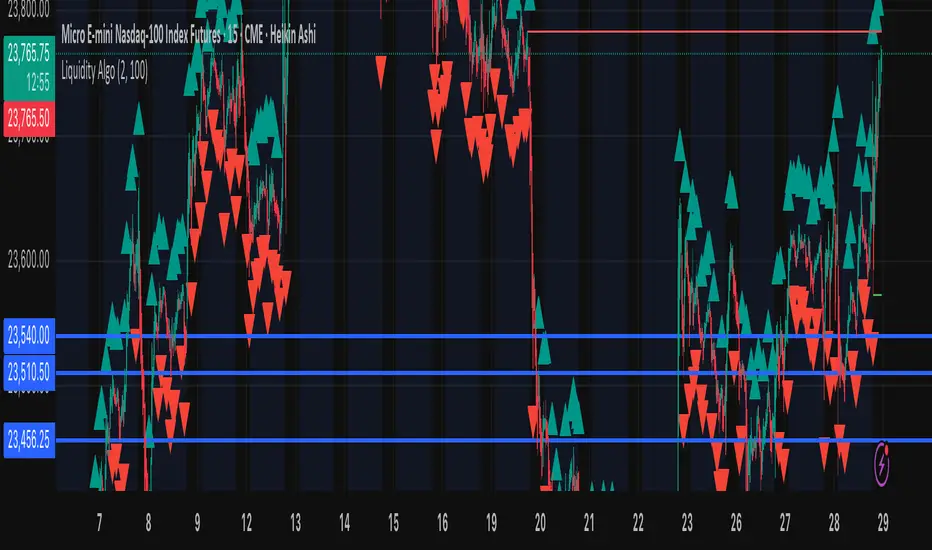
White lines = pending liquidity levels (untested).
Red lines = liquidity taken from above (buy-side liquidity sweep).
Green lines = liquidity taken from below (sell-side liquidity sweep).
Alerts trigger when price breaks a liquidity line.
This tool helps traders track where liquidity might be resting and visualize when price sweeps it — useful for smart money concepts (SMC), ICT-style trading, and liquidity-based strategies.
Invite-only script
Only users approved by the author can access this script. You'll need to request and get permission to use it. This is typically granted after payment. For more details, follow the author's instructions below or contact Quantel_io directly.
TradingView does NOT recommend paying for or using a script unless you fully trust its author and understand how it works. You may also find free, open-source alternatives in our community scripts.
Author's instructions
Disclaimer
Invite-only script
Only users approved by the author can access this script. You'll need to request and get permission to use it. This is typically granted after payment. For more details, follow the author's instructions below or contact Quantel_io directly.
TradingView does NOT recommend paying for or using a script unless you fully trust its author and understand how it works. You may also find free, open-source alternatives in our community scripts.