OPEN-SOURCE SCRIPT
Percent change bar chart v 2.0
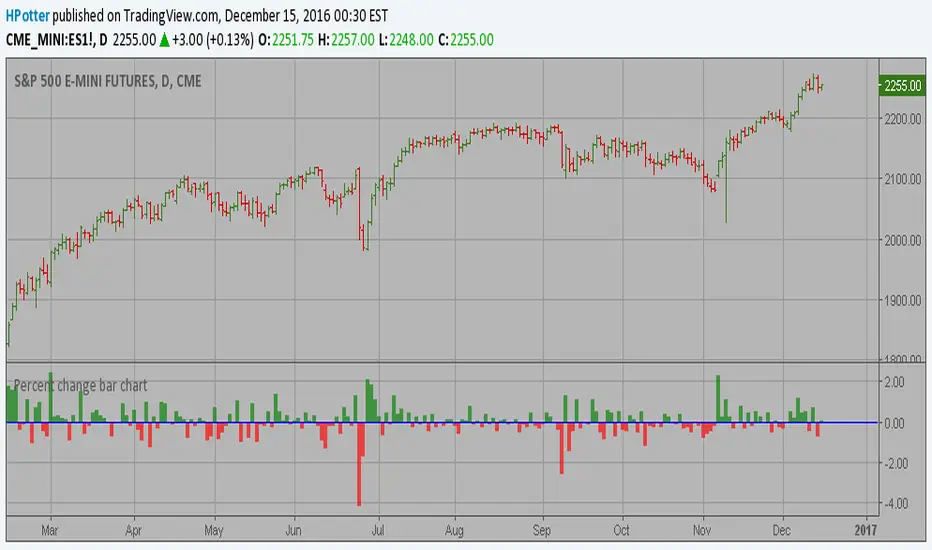
This histogram displays price or % change from previous bar.
Can be applied to any time frame.
15/12/2016 Update:
Number of digits after the floating point for study values on the axis now two.
Can be applied to any time frame.
15/12/2016 Update:
Number of digits after the floating point for study values on the axis now two.
Open-source script
In true TradingView spirit, the creator of this script has made it open-source, so that traders can review and verify its functionality. Kudos to the author! While you can use it for free, remember that republishing the code is subject to our House Rules.
Disclaimer
The information and publications are not meant to be, and do not constitute, financial, investment, trading, or other types of advice or recommendations supplied or endorsed by TradingView. Read more in the Terms of Use.