PROTECTED SOURCE SCRIPT
Updated Initial Balance + Extensions
Overview
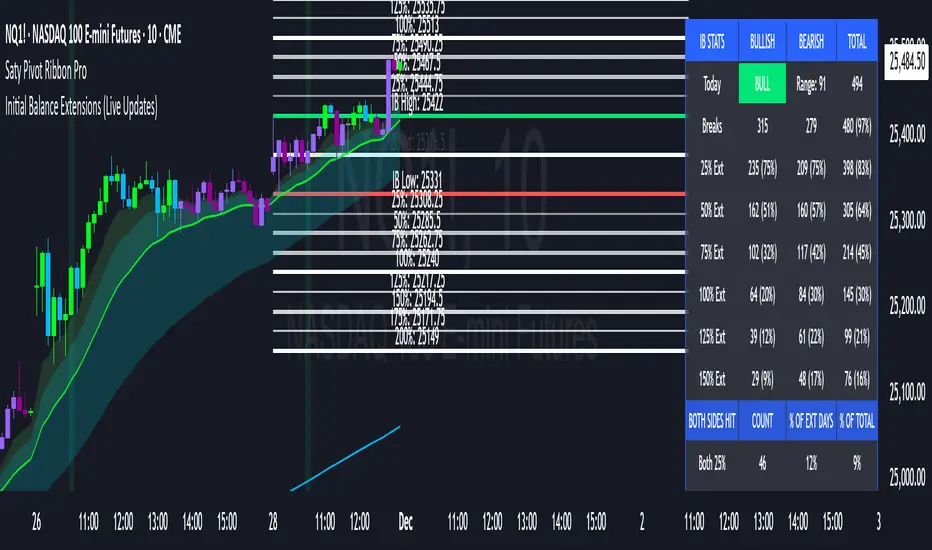
Tracks the Initial Balance (IB) range formed during the first hour of trading (9:30-10:30 AM EST) and projects extension levels to identify potential price targets throughout the session.
What It Does
Monitors the 9:30-10:30 AM EST period to establish IB High, IB Low, and Midline
Calculates extension levels at 25%, 50%, 75%, and 100% of the IB range (both above and below)
Identifies directional bias by comparing the 10:30 AM close to the IB midline
Tracks historical statistics showing breakout frequency and extension hit rates
Updates in real-time during the IB session
Key Features
Live updating IB levels during market hours
Customizable extension percentages (toggle 25%, 50%, 75%, 100%)
Visual directional bias signal (bullish/bearish candle shading at 10:30 AM)
Comprehensive statistics table with breakout rates and extension success percentages
Historical view of past IB levels (configurable lookback period)
Fully customizable colors, labels, and display options
Best Use Cases
Day trading: Use IB levels as support/resistance and extensions as profit targets
Breakout trading: Enter on IB High/Low breaks with defined targets
Range trading: Trade within IB when contained days are likely
Market profiling: Understand price acceptance and rejection zones
Settings
All visual elements are customizable including:
Line colors (default: gray for neutral appearance)
Label styles and sizes
Extension level visibility
Statistics table position and size
Historical data display (0-10 past days)
Technical Notes
Optimized for US market hours (EST/EDT timezone)
Works on any timeframe (1min, 5min, 15min recommended)
Best suited for liquid instruments (ES, NQ, SPY, QQQ, stocks)
Statistics accumulate over time for improved accuracy
Educational Purpose
Based on Initial Balance theory from Market Profile, this indicator helps traders identify key price levels and understand market structure during the trading day. It is not financial advice and should be used as part of a comprehensive trading plan.
Note: Past performance statistics do not guarantee future results. Always practice proper risk management.
Release Notes
table updateRelease Notes
added noon timing to tableRelease Notes
table updateRelease Notes
Added extensions and tracking up to 200%Added Day of the week tracking
Added IB range size tracking with customizable range - Select ES/NQ/RTY from dropdown for preset ranges
Added previous days ranges
All features optionable
Protected script
This script is published as closed-source. However, you can use it freely and without any limitations – learn more here.
Disclaimer
The information and publications are not meant to be, and do not constitute, financial, investment, trading, or other types of advice or recommendations supplied or endorsed by TradingView. Read more in the Terms of Use.