OPEN-SOURCE SCRIPT
200WMA Screener
Description:
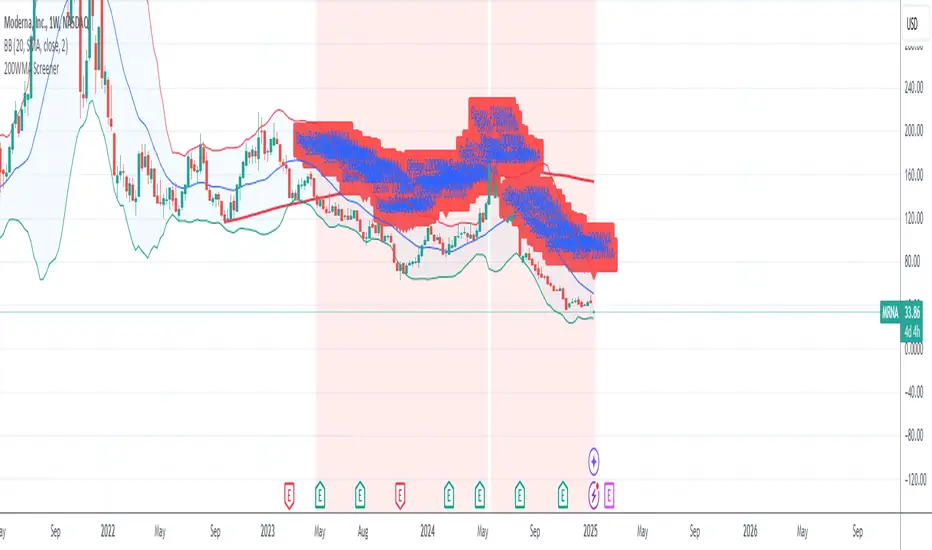
This custom indicator helps identify stocks trading below their 200-week moving average (200WMA), a key technical indicator often used to analyze long-term trends. The script calculates the 200WMA using weekly close prices and provides the following features:
Visual Plot: Displays the 200WMA as a smooth line on the chart for easy trend analysis.
Background Highlight: Automatically highlights the chart background when the current price is below the 200WMA, signaling a potential bearish trend or undervalued stock.
Alert System: Includes an alert condition to notify you when a stock trades below its 200WMA, so you never miss an opportunity.
Compatibility: Works across all assets (stocks, forex, crypto) and automatically adapts to the selected ticker.
This script is ideal for traders and investors looking for long-term opportunities, identifying potential trend reversals, or spotting undervalued stocks.
Open-source script
In true TradingView spirit, the creator of this script has made it open-source, so that traders can review and verify its functionality. Kudos to the author! While you can use it for free, remember that republishing the code is subject to our House Rules.
Disclaimer
The information and publications are not meant to be, and do not constitute, financial, investment, trading, or other types of advice or recommendations supplied or endorsed by TradingView. Read more in the Terms of Use.