OPEN-SOURCE SCRIPT
TCC Mean Reversion
TCC Mean Reversion Indicator.
This is the mean reversion indicator. Mean reversions
are my favourite trades. You need to know how to trade
it, and find the best entries.
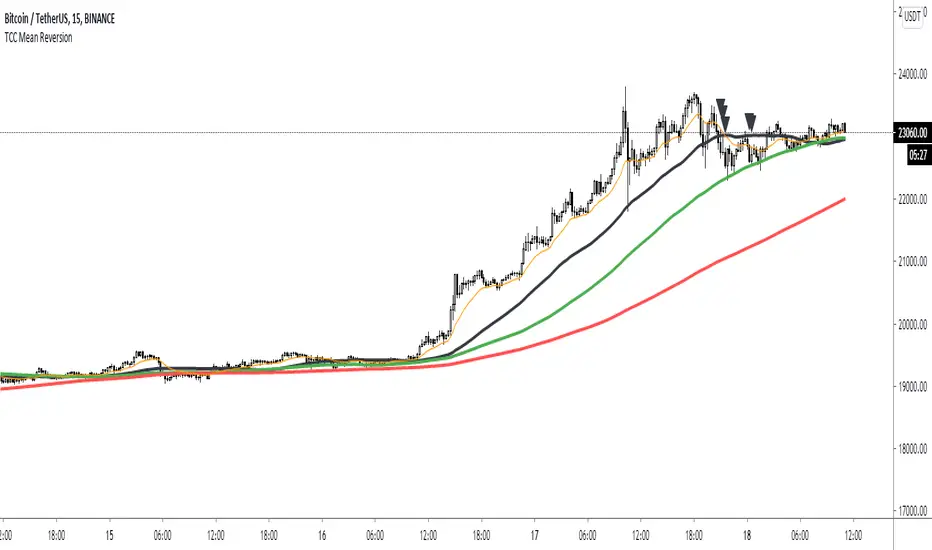
The mean reversion signals are plotted by this chart as triangles.
- black triangle: mean reversion to the SMA50
- green triangle: mean reversion to the SMA100
- red triangle: mean reversion to the SMA200
- black line: SMA50
- green line: SMA100
- red line: SMA200
You can change the timeframe (resolution) for the plotted moving averages and signals.
This allows you to quickly find mean reversion opportunities across all timeframes.
This is a very powerful tool, if used correctly.
Feel free to add them to your trading toolkit.
Regards,
Carl Everest.
This is the mean reversion indicator. Mean reversions
are my favourite trades. You need to know how to trade
it, and find the best entries.
The mean reversion signals are plotted by this chart as triangles.
- black triangle: mean reversion to the SMA50
- green triangle: mean reversion to the SMA100
- red triangle: mean reversion to the SMA200
- black line: SMA50
- green line: SMA100
- red line: SMA200
You can change the timeframe (resolution) for the plotted moving averages and signals.
This allows you to quickly find mean reversion opportunities across all timeframes.
This is a very powerful tool, if used correctly.
Feel free to add them to your trading toolkit.
Regards,
Carl Everest.
Open-source script
In true TradingView spirit, the creator of this script has made it open-source, so that traders can review and verify its functionality. Kudos to the author! While you can use it for free, remember that republishing the code is subject to our House Rules.
Disclaimer
The information and publications are not meant to be, and do not constitute, financial, investment, trading, or other types of advice or recommendations supplied or endorsed by TradingView. Read more in the Terms of Use.