PROTECTED SOURCE SCRIPT
AZ VP Scan 40% Area
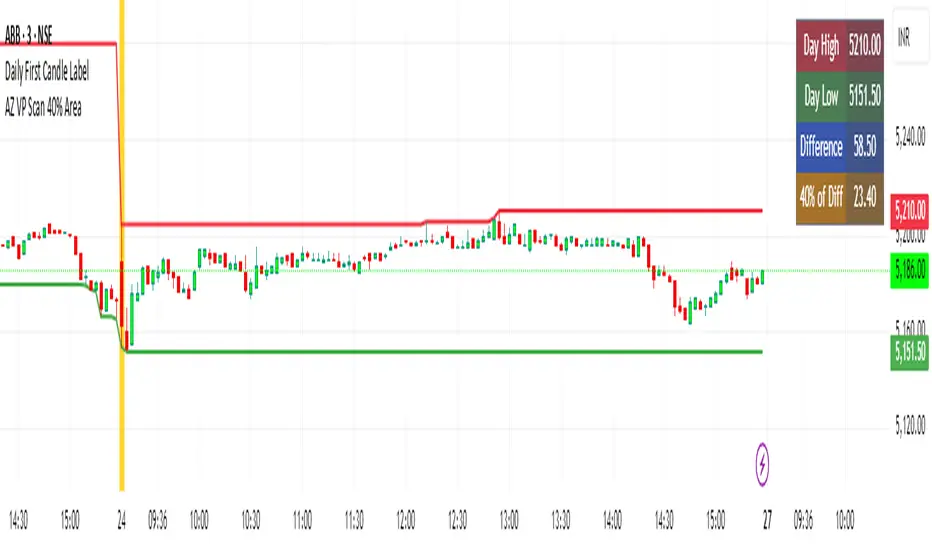
This indicator is developed by Ankur Zaveri, Gujarat, India. This indicator marks the Day's High and Day's Low for the underlying and calculates the difference between the two extrme values of the day in a separate table on the chart. It also shows 40% value of the difference between the Day's High and Day's Low to help scan the underlyings for taking trades based on Volume Profile.
Protected script
This script is published as closed-source. However, you can use it freely and without any limitations – learn more here.
Disclaimer
The information and publications are not meant to be, and do not constitute, financial, investment, trading, or other types of advice or recommendations supplied or endorsed by TradingView. Read more in the Terms of Use.