PROTECTED SOURCE SCRIPT
9, 21, 50 EMA TN
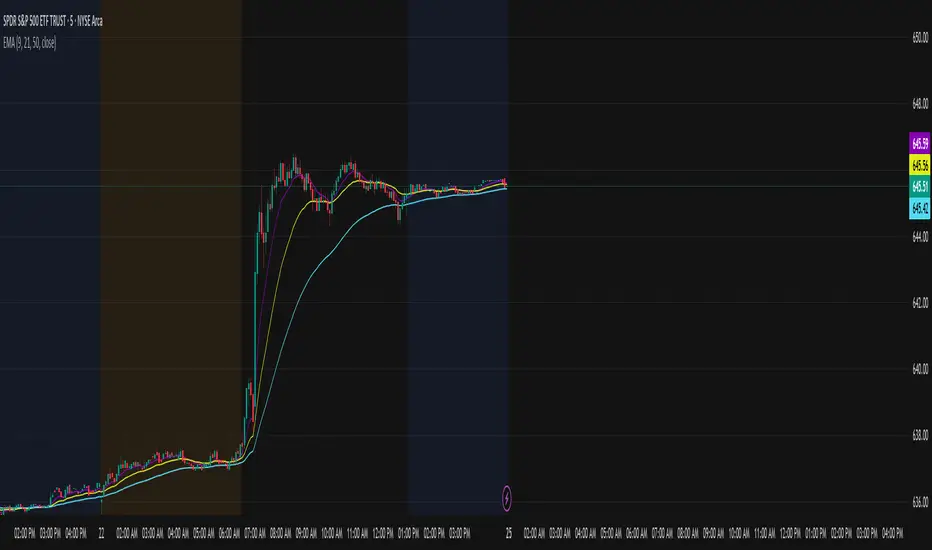
This indicator plots three exponential moving averages (EMAs) on the chart:
9 EMA (purple) – short-term trend and momentum
21 EMA (yellow) – medium-term trend
50 EMA (cyan) – long-term trend and overall market direction
How it’s used:
Traders look for the 9 EMA to cross above the 21 EMA as a potential bullish signal. This suggests upward momentum and may be used as confirmation for call entries.
Conversely, when the 9 EMA crosses below the 21 EMA, it can indicate bearish momentum, often used as confirmation for put entries.
The 50 EMA acts as a higher timeframe filter: when price and the shorter EMAs are above the 50 EMA, it confirms bullish bias; when they’re below, it confirms bearish bias.
This tool helps identify short-term momentum shifts while staying aligned with the larger market trend.
Protected script
This script is published as closed-source. However, you can use it freely and without any limitations – learn more here.
Disclaimer
The information and publications are not meant to be, and do not constitute, financial, investment, trading, or other types of advice or recommendations supplied or endorsed by TradingView. Read more in the Terms of Use.