OPEN-SOURCE SCRIPT
CHK 3TIMEFRAME RSI OB-OS SCREENER
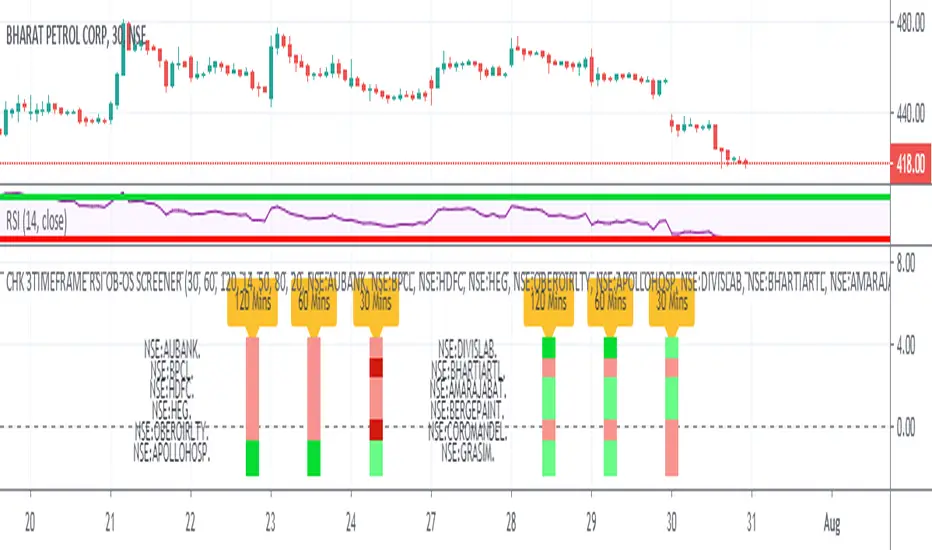
Sharing RSI Screener. It shows RSI Situation for 12 Stocks.
User can replace the stocks as per their respective exchange
User can select 3 Time Frames of his/her choice
User can change the OverBought / OverSold Values to 70/30. This indicator uses 80/20.
RSI BELOW 50 = PINK COLOR
OVERSOLD = MAROON COLOR
RSI ABOVE 50 = LIGHT GREEN COLOR
OVERBOUGHT = DARK GREEN COLOR
For Example : This Chart and the Indicator snapshot shows, the stock BPCL is Oversold for the 30 Min TimeFrame
For Example : The indicator snapshot shows, the stocks HDFC and AUBANK have their RSI's below 50 across the 30 Min / 60 Min / 120 Min
TimeFrames
Please give it some time to load, and every time you change Resolution.
Add another one, to have a screener screening 24 stocks :)
Open-source script
In true TradingView spirit, the creator of this script has made it open-source, so that traders can review and verify its functionality. Kudos to the author! While you can use it for free, remember that republishing the code is subject to our House Rules.
Disclaimer
The information and publications are not meant to be, and do not constitute, financial, investment, trading, or other types of advice or recommendations supplied or endorsed by TradingView. Read more in the Terms of Use.