OPEN-SOURCE SCRIPT
Jackson Hole Meetings - Lines and Labels
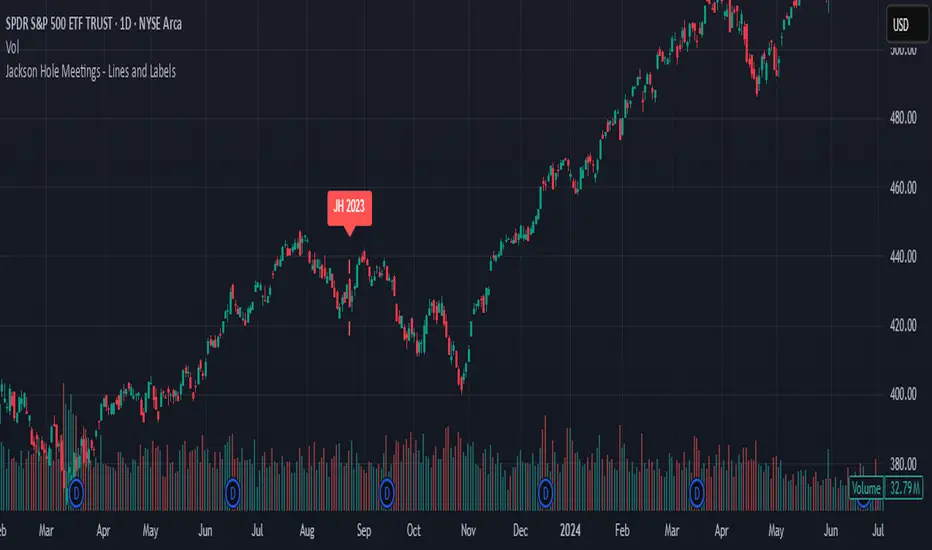
This TradingView Pine Script indicator marks the dates of the Federal Reserve’s annual Jackson Hole Economic Symposium meetings on your chart. For each meeting date from 2020 through 2025, it draws a red dashed vertical line directly on the corresponding daily bar. Additionally, it places a label above the bar indicating the year of the meeting (e.g., "JH 2025").
Features:
Marks all known Jackson Hole meeting dates from 2020 to 2025.
Draws a vertical dashed line on each meeting day for clear visual identification.
Displays a label above the candle with the meeting year.
Works best on daily timeframe charts.
Helps traders quickly spot potential market-moving events related to Jackson Hole meetings.
Use this tool to visually correlate price action with these key Federal Reserve events and enhance your trading analysis.
Open-source script
In true TradingView spirit, the creator of this script has made it open-source, so that traders can review and verify its functionality. Kudos to the author! While you can use it for free, remember that republishing the code is subject to our House Rules.
Disclaimer
The information and publications are not meant to be, and do not constitute, financial, investment, trading, or other types of advice or recommendations supplied or endorsed by TradingView. Read more in the Terms of Use.