OPEN-SOURCE SCRIPT
Updated Vector Trinity indicator II: [Bottom: TTM Squeeze]
**1. Introduction: The Engine of the System**
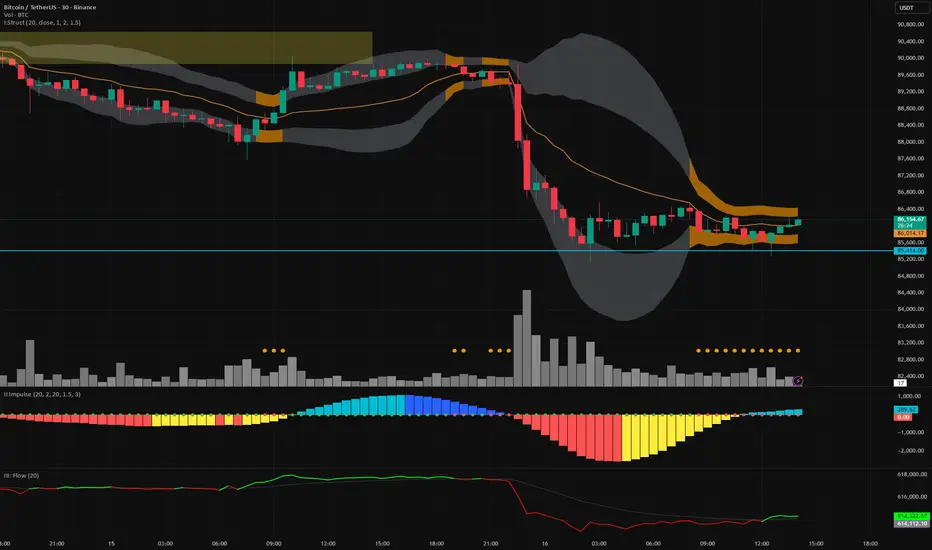
This indicator is **Part 2** of the "Vector Trinity" trading system. While Part I (Structure) defines *where* the price is, **Part II (Impulse)** defines *when* the move will happen and *how strong* it is.
It represents the **Time Dimension** of the system, focusing on momentum ignition and energy release.
* **I: Structure:** Spatial boundaries.
* **II: Impulse:** **Momentum velocity & Squeeze timing (Current Indicator).**
* **III: Flow:** Capital validation.
**2. Core Logic: Linear Regression Momentum**
Unlike standard momentum indicators (like MACD) which are based on Moving Averages and often lag significantly, **Vector Trinity II** utilizes **Linear Regression** on price deviations.
* **Math:** It calculates the distance between the price and the mean, then runs a linear regression to determine the angle of attack.
* **Benefit:** This provides a near-instantaneous reading of market "Velocity" and "Acceleration," reducing lag and allowing traders to see the turn before price fully commits.
**3. The "Squeeze" Mechanics (The Dots)**
The central line features dots that indicate the volatility state of the market:
* **🔴 Red Dot (Squeeze ON):** The Bollinger Bands have moved inside the Keltner Channels. Volatility is critically low. The market is storing energy like a compressed spring. **Action:** Wait. Do not trade yet.
* **🟢 Green Dot (Squeeze Fired):** The Bands have popped out of the Channels. The energy is releasing. **Action:** This is the "Ignition" signal. Look at the histogram color for direction.
**4. The 4-Color Momentum System**
The histogram bars are color-coded to tell the full story of the trend's lifecycle, not just direction:
* **Bullish Territory (Above 0):**
* **🟦 Cyan (Light Blue):** **Bullish Acceleration.** Buyers are aggressive. Momentum is increasing. (Best for entry).
* **🔷 Blue (Dark Blue):** **Bullish Deceleration.** Buyers are tired. Momentum is fading. (Prepare to take profit).
* **Bearish Territory (Below 0):**
* **🟥 Red:** **Bearish Acceleration.** Sellers are aggressive. Momentum is increasing. (Best for shorting).
* **🟨 Yellow:** **Bearish Deceleration.** Sellers are exhausted. Momentum is recovering towards zero. (Warning: Trend potential reversal).
**5. How to Use**
* **Step 1:** Look for **Red Dots** on the zero line. This identifies a high-potential setup building up.
* **Step 2:** Wait for the **First Green Dot**. This is the "Squeeze Fired" signal.
* **Step 3:** Confirm with the **Histogram Color**.
* If Green Dot + **Cyan Bar** = Long Signal.
* If Green Dot + **Red Bar** = Short Signal.
* **Advanced:** Use the **Yellow Bars** as an early warning to exit short positions before price actually reverses.
**Settings:**
* **Length:** 20 (Standard calculation period).
* **BB/KC Mult:** 2.0 / 1.5 (Standard ratios to define the Squeeze).
* **Smoothing:** Enabled (Default 3) to reduce noise and provide clearer color transitions.
---
### **中文说明**
**1. 简介:系统的核心引擎**
本指标是“矢量三位一体”交易系统的 **第二部分**。如果说第一部分 (Structure) 定义了价格*在哪里*,那么 **第二部分 (Impulse)** 则定义了行情*何时*启动以及力度*有多强*。
它代表了系统的 **时间维度**,专注于动能的点火与能量释放。
* **I: Structure 结构:** 空间边界。
* **II: Impulse 脉冲:** **动能速度与挤压时机(本指标)。**
* **III: Flow 流向:** 资金验证。
**2. 核心逻辑:线性回归动能**
传统的动能指标(如 MACD)通常基于移动平均线,存在显著的滞后性。**Vector Trinity II** 采用了基于价格偏离度的 **Linear Regression (线性回归)** 算法。
* **数学原理:** 它计算价格与均值的距离,并通过回归分析确定攻击的角度。
* **优势:** 这提供了几乎零滞后的市场“速度”与“加速度”读数,允许交易者在价格完全反转之前看到动能的拐点。
**3. “挤压”机制 (圆点信号)**
0轴上的圆点指示了市场的波动率状态:
* **🔴 红点 (Squeeze ON):** 布林带完全进入了肯特纳通道内部。波动率极低。市场像被压缩的弹簧一样在积蓄能量。**操作:** 等待,不要急于进场。
* **🟢 绿点 (Squeeze Fired):** 布林带扩张冲出通道。能量开始释放。**操作:** 这是“点火”信号。观察柱状图颜色以确定方向。
**4. 四色动能战术系统**
柱状图通过四种颜色讲述了趋势完整的生命周期,而不仅仅是涨跌:
* **多头区域 (0轴上方):**
* **🟦 青色 (Cyan):** **多头加速。** 买盘积极,动能增强。(最佳进场期)
* **🔷 蓝色 (Blue):** **多头减速。** 买盘疲惫,动能衰减。(准备止盈)
* **空头区域 (0轴下方):**
* **🟥 红色 (Red):** **空头加速。** 卖盘积极,动能增强。(最佳做空期)
* **🟨 黄色 (Yellow):** **空头减速。** 卖盘力竭,动能向0轴修复。(警告:趋势可能反转/抄底信号)
**5. 使用方法**
* **第一步:** 寻找0轴上的 **红点**。这标志着一个高爆发潜力的机会正在酝酿。
* **第二步:** 等待 **第一个绿点** 出现。这是“挤压释放/点火”的信号。
* **第三步:** 结合 **柱状图颜色** 确认。
* 绿点 + **青色柱** = 做多信号。
* 绿点 + **红色柱** = 做空信号。
* **进阶用法:** 利用 **黄色柱** 作为空单止盈的先行指标,往往在价格反弹之前,动能就已经变黄了。
**参数设置:**
* **Length (周期):** 20 (标准计算周期)。
* **BB/KC Mult (倍数):** 2.0 / 1.5 (定义挤压状态的标准比率)。
* **Smoothing (平滑):** 开启 (默认3) 以减少噪音,提供更平滑的颜色转换体验。
Release Notes
UPDATE ColorOpen-source script
In true TradingView spirit, the creator of this script has made it open-source, so that traders can review and verify its functionality. Kudos to the author! While you can use it for free, remember that republishing the code is subject to our House Rules.
Disclaimer
The information and publications are not meant to be, and do not constitute, financial, investment, trading, or other types of advice or recommendations supplied or endorsed by TradingView. Read more in the Terms of Use.
Open-source script
In true TradingView spirit, the creator of this script has made it open-source, so that traders can review and verify its functionality. Kudos to the author! While you can use it for free, remember that republishing the code is subject to our House Rules.
Disclaimer
The information and publications are not meant to be, and do not constitute, financial, investment, trading, or other types of advice or recommendations supplied or endorsed by TradingView. Read more in the Terms of Use.