OPEN-SOURCE SCRIPT
Price Action Health Check
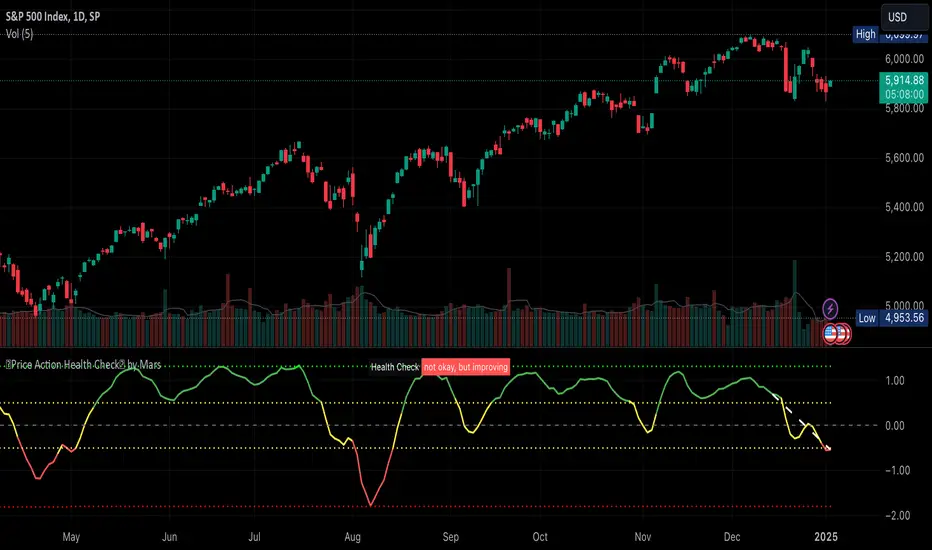
This is a price action indicator that measures market health by comparing EMAs, adapting automatically to different timeframes (Weekly/Daily more reliable) and providing context-aware health status.
Key features:
Trading applications:
I like to use it to keep SPX in check before deciding the market is going down.
Note: For optimal analysis, use primarily on Weekly and Daily timeframes where price action patterns are more significant.
Key features:
- Automatically adjusts EMA periods based on timeframe
- Measures price action health through EMA separation and historical context
- Provides visual health status with clear improvement/deterioration signals
- Projects a 13-period trend line for directional context
Trading applications:
- Identify shifts in market health before major trend changes
- Validate trend strength by comparing current readings to historical averages
- Time entries/exits based on health status transitions
- Filter trades using timeframe-specific health readings
I like to use it to keep SPX in check before deciding the market is going down.
Note: For optimal analysis, use primarily on Weekly and Daily timeframes where price action patterns are more significant.
Open-source script
In true TradingView spirit, the creator of this script has made it open-source, so that traders can review and verify its functionality. Kudos to the author! While you can use it for free, remember that republishing the code is subject to our House Rules.
Cyclist, Trader, Technologist. Get access to data for my options indicators on smartcanvas.com for free via bots
Disclaimer
The information and publications are not meant to be, and do not constitute, financial, investment, trading, or other types of advice or recommendations supplied or endorsed by TradingView. Read more in the Terms of Use.