OPEN-SOURCE SCRIPT
Multi-Timeframe Support & Resistance
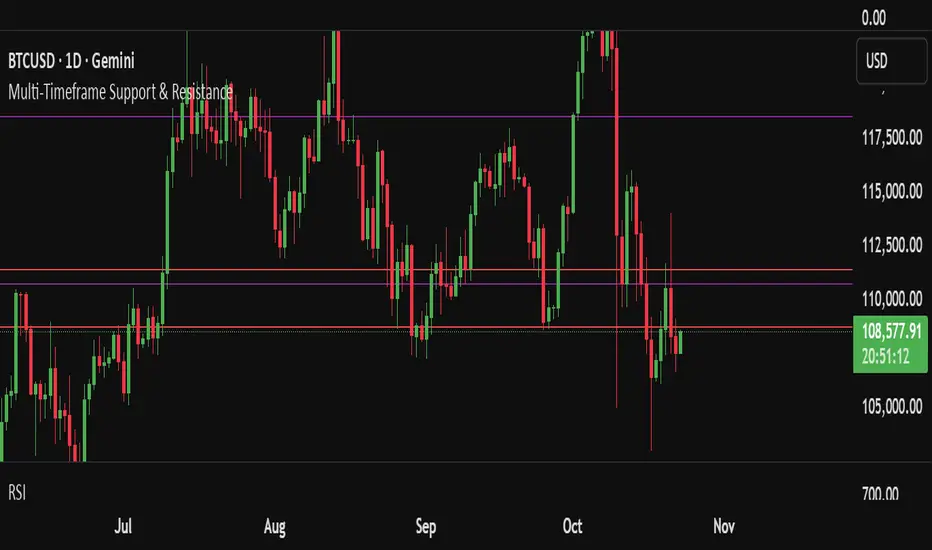
This indicator automatically plots dynamic support and resistance levels across multiple timeframes — including 1H, 4H, 1D, 1W, 1M, and the current chart timeframe. Each level is color-coded for clarity and extends across the chart to highlight key price zones.
**Key Features:**
- ⏱ Multi-timeframe analysis: 6 configurable timeframes
- 🎨 Custom color and style settings for each timeframe
- 📏 Adjustable number of levels per timeframe
- 🧼 Clean chart layout with no duplicate lines
- 🔄 Auto-refresh every 10 bars for up-to-date levels
Support and resistance levels are calculated using historical high/low ranges and evenly distributed across the selected lookback period. This helps traders identify confluence zones, breakout targets, and reversal areas with precision.
Open-source script
In true TradingView spirit, the creator of this script has made it open-source, so that traders can review and verify its functionality. Kudos to the author! While you can use it for free, remember that republishing the code is subject to our House Rules.
Disclaimer
The information and publications are not meant to be, and do not constitute, financial, investment, trading, or other types of advice or recommendations supplied or endorsed by TradingView. Read more in the Terms of Use.