OPEN-SOURCE SCRIPT
Variance (Welford) [Loxx]
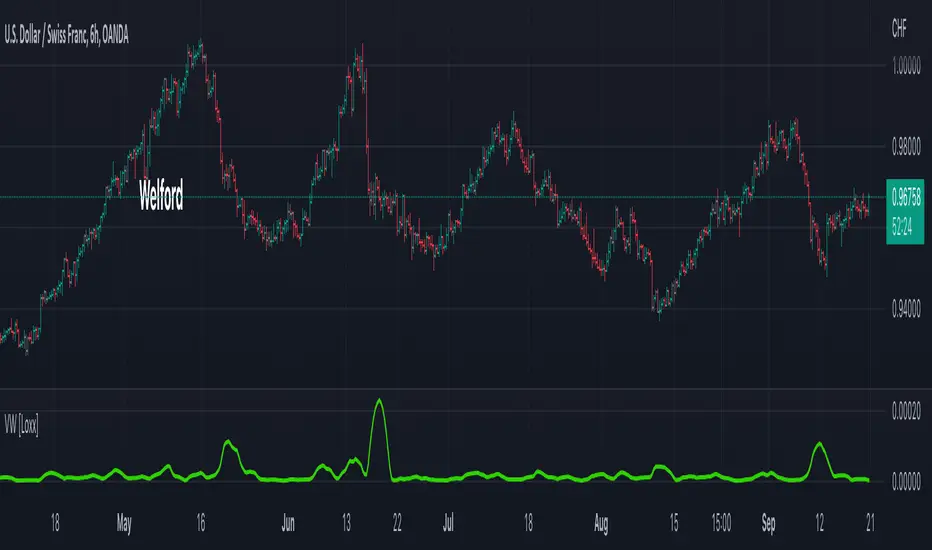
The standard deviation is a measure of how much a dataset differs from its mean; it tells us how dispersed the data are. A dataset that’s pretty much clumped around a single point would have a small standard deviation, while a dataset that’s all over the map would have a large standard deviation. You can. use this calculation for other indicators.
Given a sample the standard deviation is defined as the square root of the variance
Here you can find a Welford’s method for computing (single pass method) that avoids errors in some cases (if the variance is small compared to the square of the mean, and computing the difference leads catastrophic cancellation where significant leading digits are eliminated and the result has a large relative error)
Read more here: https://jonisalonen.com/2013/deriving-welfords-method-for-computing-variance/
Incliuded
- Loxx's Expanded Source Types
Open-source script
In true TradingView spirit, the creator of this script has made it open-source, so that traders can review and verify its functionality. Kudos to the author! While you can use it for free, remember that republishing the code is subject to our House Rules.
Public Telegram Group, t.me/algxtrading_public
VIP Membership Info: patreon.com/algxtrading/membership
VIP Membership Info: patreon.com/algxtrading/membership
Disclaimer
The information and publications are not meant to be, and do not constitute, financial, investment, trading, or other types of advice or recommendations supplied or endorsed by TradingView. Read more in the Terms of Use.