PROTECTED SOURCE SCRIPT
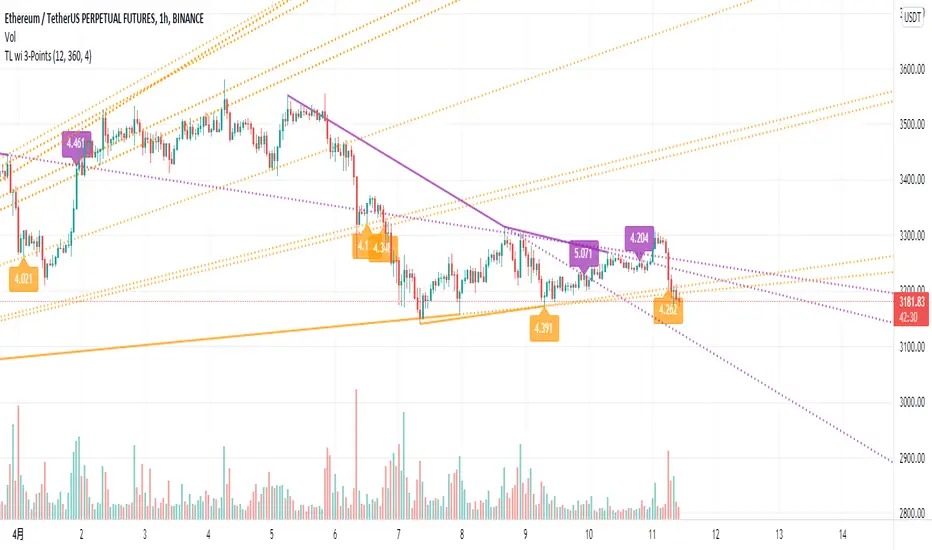
Updated Trend Line wi 3-Points

Hello, my friends. This is a new version of the trend line regression indicator, which always finds quantitive trend lines with three key points.
(1) Indicator description
(2) Key parameters
- Pivot High/Low Settings
- Trend Line Regression
(3) Script description
Happy trading, and enjoy your life!
————————————————————————————————————————
各位朋友大家好,这是一个全新的趋势线回归指标。该指标总是会找到在图表中具有3个关键点的合理趋势线
(1) 指标说明
(2) 关键参数
- Pivot High/Low Settings
- Trend Line Regression
(3) 脚本说明
祝大家交易愉快
(1) Indicator description
- This indicator finds a trend line with three key points on the historical K-line
- Solving the problem of calculation timeout based on a faster trend line regression algorithm
- Supports filtering unwanted trend lines by setting a trendline strength threshold
- It's suitable for most markets and timeframes
(2) Key parameters
- Pivot High/Low Settings
- Pivot Lookback Left: Number of K-lines to look back left from the pivot top/bottom
- Pivot Lookback Right: Number of K-lines to look back right from the pivot top/bottom
- Trend Line Regression
- Max of Lookback Forward: The maximum number of historical K-lines
- Min Regression Strength: The minimum strength threshold for trend line regression
- Multiply Regression Std: The width of the trend line to display on the chart
(3) Script description
- Due to some circumstances that I don't want to see, subsequent scripts will not be open source, but you can still use the script for free. Thanks for your understanding and support!
- If you have any suggestions or comments about the script, please feel free to leave your comments!
Happy trading, and enjoy your life!
————————————————————————————————————————
各位朋友大家好,这是一个全新的趋势线回归指标。该指标总是会找到在图表中具有3个关键点的合理趋势线
(1) 指标说明
- 该指标在历史K线上找到具有3个关键点的趋势线,并绘制于图表上
- 基于更快速的趋势线回归算法,解决了计算超时的问题
- 支持通过设置趋势线强度阈值过滤不需要的趋势线
- 该指标适用于大部分市场和时间周期
(2) 关键参数
- Pivot High/Low Settings
- Pivot Lookback Left: 枢纽顶/底点往左回顾的 K线 数量
- Pivot Lookback Right: 枢纽顶/底点往右回顾的 K线 数量
- Trend Line Regression
- Max of Lookback Forward: 回顾历史 K线 的最大数量
- Min Regression Strength: 趋势线回归的最小强度阈值
- Multiply Regression Std: 趋势线的显示宽度
(3) 脚本说明
- 因为出现了一些我不希望看到的情况,后续的脚本将不再开源代码,但是您依然可以免费使用该脚本,感谢理解和支持!
- 如果您存在对于该脚本的使用建议或者意见,欢迎各位留言!
祝大家交易愉快
Release Notes
2022-04-11 Updates for script Trend Line wi 3-Points(1) Update description
- Supports setting alerts for trend lines, and pop alerts immediately after a trend line appears;
- New version is more suitable for short-term trading but better to wait for trend lines to be confirmed or broken;
- The number of parameters is reduced to 3, which makes operation and setting more convenient
(2) Key parameters
- Trend Line Regression
- Pivot Lookback Period: Number of K-lines to look back left/right from the pivot top/bottom
- Max of Lookback Forward: The maximum number of historical K-lines
- Min Regression Strength: The minimum strength threshold for trend line regression
Happy trading, and enjoy your life!
————————————————————————————————————————
(1) 更新说明
- 支持设置趋势线形成的警报,当前K线出现趋势线后立即提醒
- 更加适合于短线交易,但是您需要留意趋势线是否确认或被突破
- 参数减少为3个,操作和设置更加方便
(2) 关键参数
- Trend Line Regression
- Pivot Lookback Period: 枢纽顶/底点往左/右回顾的 K线 数量
- Max of Lookback Forward: 回顾历史 K线 的最大数量
- Min Regression Strength: 趋势线回归的最小强度阈值
祝大家交易愉快
Release Notes
2022-05-06 Updates for script Trend Line wi 3-Points(1) Update description
- Add function: Support delaying N bars to confirm trend line;
(2) Key parameters
- Trend Line Regression
- Pivot Lookback Period: Number of K-lines to look back left/right from the pivot top/bottom
- Max of Lookback Forward: The maximum number of historical K-lines
- Min Regression Strength: The minimum strength threshold for trend line regression
- Delay to Confirm Trend Line: Delay N bars to confirm the trend line
Happy trading, and enjoy your life!
————————————————————————————————————————
(1) 更新说明
- 新增功能:支持设置延迟 N 根 K 线以确认趋势线;
(2) 关键参数
- Trend Line Regression
- Pivot Lookback Period: 枢纽顶/底点往左/右回顾的 K线 数量
- Max of Lookback Forward: 回顾历史 K线 的最大数量
- Min Regression Strength: 趋势线回归的最小强度阈值
- Delay to Confirm Trend Line: 延迟 N 根 K 线以确认趋势线
祝大家交易愉快
Protected script
This script is published as closed-source. However, you can use it freely and without any limitations – learn more here.
Disclaimer
The information and publications are not meant to be, and do not constitute, financial, investment, trading, or other types of advice or recommendations supplied or endorsed by TradingView. Read more in the Terms of Use.