OPEN-SOURCE SCRIPT
[Volatility] [Gain & Loss] - Overview

Indicator Overview: Volatility & Gain/Loss - Forex Pair Analysis
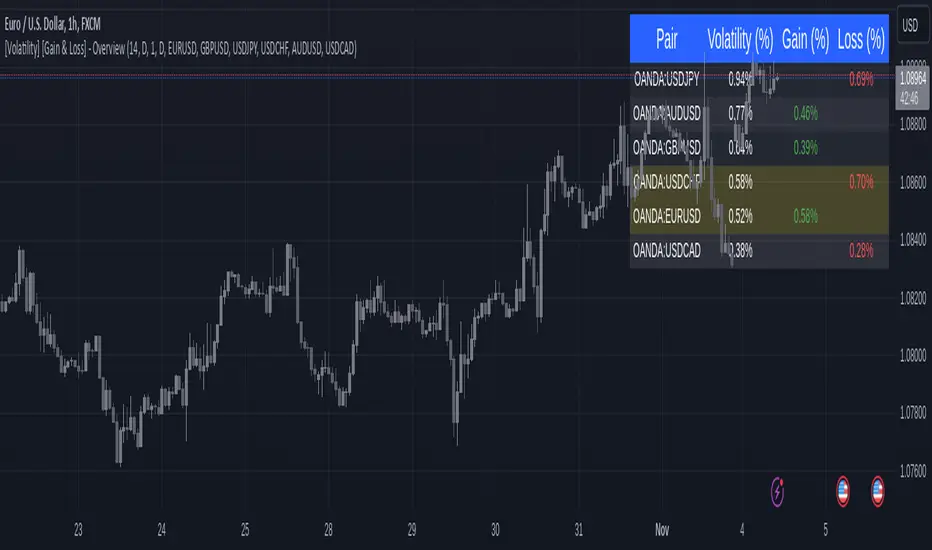
This indicator, "[Volatility] [Gain & Loss]—Overview", is designed for users interested in analyzing the volatility and gain/loss metrics of multiple forex pairs. The tool is especially useful for traders aiming to assess currency pair volatility alongside gain and loss percentages over selected periods. It enables a clearer understanding of pair behavior and aids in decision-making.
Key Features
- Customizable Volatility and Gain/Loss Periods: Define your preferred calculation periods and timeframes for both volatility and gain/loss to tailor the indicator to specific trading strategies. Multi-Pair Analysis: This indicator supports up to six forex pairs (default pairs include EURUSD, GBPUSD, USDJPY, USDCHF, AUDUSD, and USDCAD) and allows you to adjust these pairs as needed. Visual Ranking: Forex pairs are sorted by volatility, displaying the highest pairs at the top for quick reference. Top Gain/Loss Highlighting: The pair with the maximum gain and the pair with the maximum loss are highlighted in the table, making it easy to identify the best and worst performers at a glance.
Indicator Settings
- Volatility Settings:
- Period: Adjust the number of periods used in the ATR (Average True Range) calculation. A default period of 14 is set.
- Timeframe: Select a timeframe (e.g., Daily, Weekly) for volatility calculation to match your analysis preference.
- Period: Choose the number of periods for gain/loss calculation. The default is set to 1.
- Timeframe: Select the timeframe for gain/loss calculation, independent of the volatility timeframe.
- Configure up to six forex pairs. By default, popular forex pairs are pre-loaded but can be customized to include other currency pairs.
Output and Visualization
- Table Display: This indicator displays data in a neatly structured table positioned in the top-right corner of your chart.
- Columns: Includes columns for the Forex Pair, Volatility Percentage, Gain Percentage, and Loss Percentage. Color Coding:
- Volatility is displayed in a standard color for clear readability. Gain values are highlighted in green, and Loss values are highlighted in red, allowing for quick visual differentiation.
- Columns: Includes columns for the Forex Pair, Volatility Percentage, Gain Percentage, and Loss Percentage. Color Coding:
How to Use
- Volatility Analysis: This metric gives insight into the average price range movements for each pair over the specified period and timeframe, helping you evaluate the potential for rapid price changes. Gain/Loss Tracking: Gain or loss percentages show the pair's recent performance, allowing you to observe whether a currency pair is trending positively or negatively over the chosen period.
- Comparative Pair Ranking: Use the table to identify pairs with the highest volatility and extremes in gain or loss to guide trading decisions based on market conditions.
Ideal For
- Swing Traders and Day Traders looking to understand short-term market fluctuations in currency pairs. Risk Management: Helps traders gauge pairs with higher risk (volatility) and recent performance (gain/loss) for informed position sizing and risk control.
This indicator is a comprehensive tool for visualizing and analyzing key forex pairs, making it an essential addition for traders looking to stay updated on volatility trends and recent price changes.
Open-source script
In true TradingView spirit, the creator of this script has made it open-source, so that traders can review and verify its functionality. Kudos to the author! While you can use it for free, remember that republishing the code is subject to our House Rules.
Disclaimer
The information and publications are not meant to be, and do not constitute, financial, investment, trading, or other types of advice or recommendations supplied or endorsed by TradingView. Read more in the Terms of Use.