OPEN-SOURCE SCRIPT
Bullish Gap Up Detection
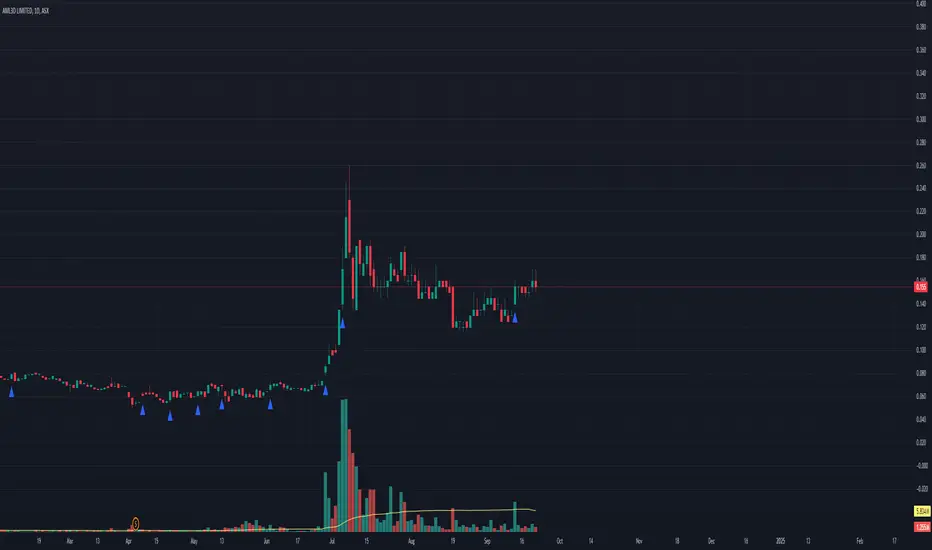
This indicator is designed to identify gap-up trading opportunities in real-time. A gap-up occurs when the opening price of a stock is higher than the previous day's high, signaling potential bullish momentum.
Key Features:
Gap Detection: The indicator detects when today’s open is above yesterday’s high and remains above that level throughout the trading session.
Visual Alerts: A triangle shape appears below the price bar when a gap-up condition is met, providing clear visual signals for traders to consider potential entry points.
EMA Analysis: The indicator incorporates two Exponential Moving Averages:
10-day EMA: Used to assess short-term price trends and help determine if the stock is currently in an upward momentum phase.
20-day EMA: Provides additional context for medium-term trends, ensuring that gaps are only considered when the stock is in a favorable trend.
The indicator confirms that the 10-day EMA is above the 20-day EMA, indicating bullish sentiment in the market.
This indicator can be used in various trading strategies to capitalize on momentum following gap-up openings. It’s suitable for day traders and swing traders looking for entry points in trending stocks.
Open-source script
In true TradingView spirit, the creator of this script has made it open-source, so that traders can review and verify its functionality. Kudos to the author! While you can use it for free, remember that republishing the code is subject to our House Rules.
Disclaimer
The information and publications are not meant to be, and do not constitute, financial, investment, trading, or other types of advice or recommendations supplied or endorsed by TradingView. Read more in the Terms of Use.