STS_RSI_MTF
The RSI options are completely adjustable. You can choose different periods for the RSI. Multiple variants for the RSI applied price can be chosen (e.g. close price, open price, high, low, etc.). Different values can be set for the Up and Down levels of the RSI.
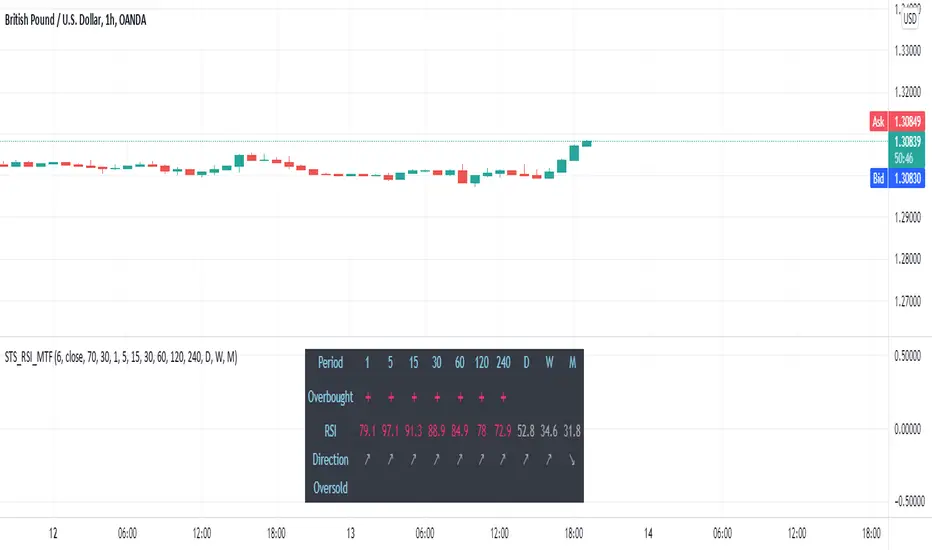
For example, if you set the STS RSI MTF indicator with Up level 70 and Down level 30, it will show in green all values below 30 (oversold), and in red all values above 70 (overbought).
Invite-only script
Only users approved by the author can access this script. You'll need to request and get permission to use it. This is typically granted after payment. For more details, follow the author's instructions below or contact SmartTradingSoftware directly.
TradingView does NOT recommend paying for or using a script unless you fully trust its author and understand how it works. You may also find free, open-source alternatives in our community scripts.
Author's instructions
Disclaimer
Invite-only script
Only users approved by the author can access this script. You'll need to request and get permission to use it. This is typically granted after payment. For more details, follow the author's instructions below or contact SmartTradingSoftware directly.
TradingView does NOT recommend paying for or using a script unless you fully trust its author and understand how it works. You may also find free, open-source alternatives in our community scripts.