PROTECTED SOURCE SCRIPT
High/Low Percentage Difference
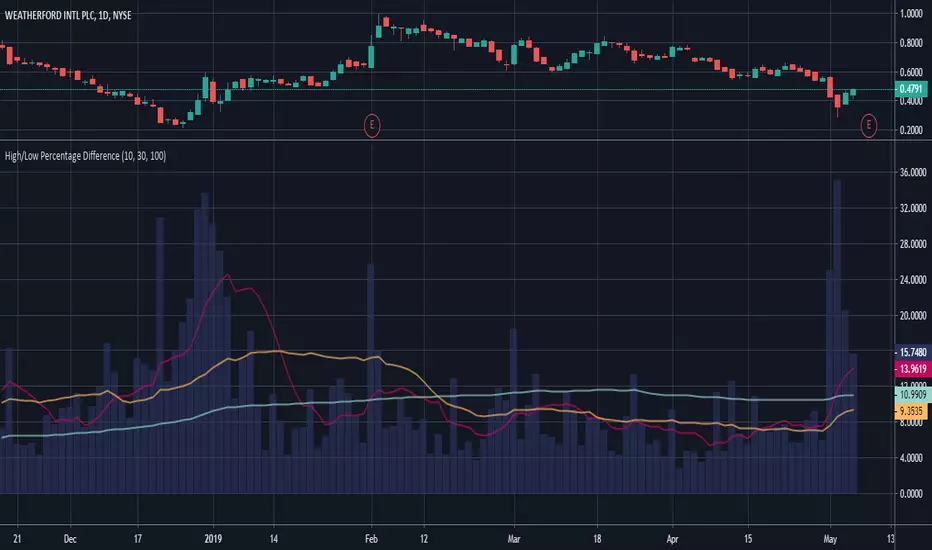
This chart shows simple moving averages of the differences in the high and low prices across the time frame you choose.
I use this when researching to see if the investment vehicle meets my criteria for volatility within the time-frame I want to invest.
The columns show the percentage difference between the current candle's high and low.
The lines show the SMA of the past 10(red), 30(orange), and 100(blue) candles, but you can edit these to be whatever you'd like.
Protected script
This script is published as closed-source. However, you can use it freely and without any limitations – learn more here.
Disclaimer
The information and publications are not meant to be, and do not constitute, financial, investment, trading, or other types of advice or recommendations supplied or endorsed by TradingView. Read more in the Terms of Use.