OPEN-SOURCE SCRIPT
Updated Mark Minervini

Hi everyone,
Just sharing a script that I made when I began to be interested in Mark Minervini, Wiliam O'Neil, Nicolas Darvas,.. trading style.
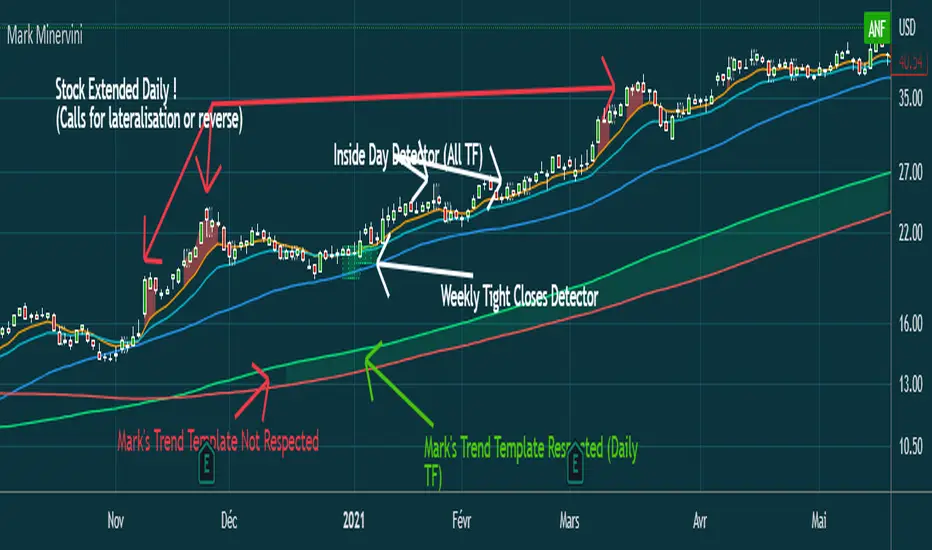
This script displays :
- 10 EMA (orange)
- 20 EMA (blue light)
- 50 SMA (blue)
-150 SMA (green)
-200 SMA (red)
- Shows when the stock is "extended" from EMA10 to high of the candle (Works in Daily, you can adjust the % to make it match with the stock's volatility)
(Shows a red area between price and 10 EMA)
- Shows when Mark Minervini's trend template is respected by highlighting green between 150 & 200 SMA.
I Although added bollinger bands and 5 EMA for very strong stocks. (I never use them)
Have fun
Release Notes
Removed useless commentsRelease Notes
Removed useless commentsRelease Notes
- Removed indicators that were polluting the visual overviewRelease Notes
- Added the possibility to display 3 Week Tight Closes to see potential accumulation (too confirm with low volume) and trade setup within STAGE 2 MarketRelease Notes
- Modified the code to only make the extended color in Daily Graph- Improved a little bit the Weekly Tight Closes Detector
Release Notes
'- Remove 'Trade'' by 'Trend' in the commentaryRelease Notes
- Now possible to display inside bars on every time frameRelease Notes
- Changes Graph Exemple- Added the possibility to modify inside day color line
- Added a bigger size to double inside days
Release Notes
- Modified Tight Closes so that they are :-> Auto-adaptable on every chart
-> Now very close to what we can see in Wiliam O'Neil's Book
-> Subtly indicated by soft boxes
-> Color can be modified in the parameters box
Honestly... I pulled myself up by my bootstraps, I'm really proud of the result ! Haha
Release Notes
- Corrected a bug that appears in Da Graph due to Tight Closes DisplayRelease Notes
- Extended Price are now auto-adaptiveRelease Notes
- Changed the green lines by boxes using box.new()- Coloured inside the lines of the inside days
- Added some comments and reorganised the code a little
Release Notes
Re-organised position and feature's namesRelease Notes
- Added comment in english regarde the 52We part (It was in French before)- Added the Mark Minervini Trend Template in comments from "Trade Like a Stock Market Wizard"
Release Notes
- Now Inside Days and Tight Closes are thinner- Removed the bolinger bands
- Added the 10 SMA in red, now possible to display it
- Adjusted the box arround Weekly Tight Closes
Release Notes
- Arranged Inputs- Now Extended Daily displays only in Daily TF
- Now Weekly Tight Closes displays only in We
- Now possible to change color of the area when trend template criteria are met
Release Notes
- The trend template is now displayed in Daily onlyRelease Notes
- Went from Pine Script v4 to v5- Added optional Peak/Valley points
Release Notes
- You can now display % variation of Peak/Valley pointsRelease Notes
- You can now adjust color of the SMA/EMA- Optimized the code a little bit
Open-source script
In true TradingView spirit, the creator of this script has made it open-source, so that traders can review and verify its functionality. Kudos to the author! While you can use it for free, remember that republishing the code is subject to our House Rules.
Disclaimer
The information and publications are not meant to be, and do not constitute, financial, investment, trading, or other types of advice or recommendations supplied or endorsed by TradingView. Read more in the Terms of Use.