OPEN-SOURCE SCRIPT
Roof and Floors From Actieve Inversiones
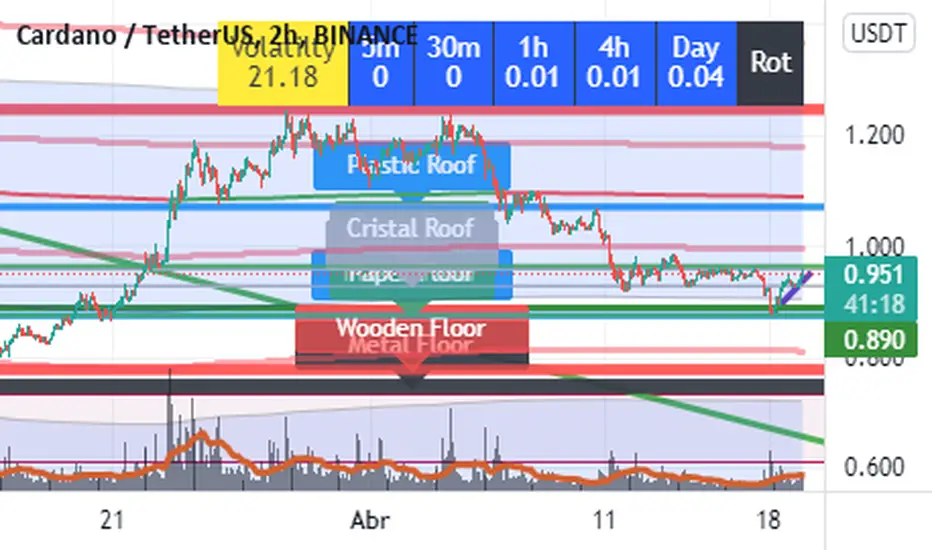
Imagine a Funny and visual way to understand Highest Highs and Lowest Lows. That's the way this indicator was conceived.
The way it Works:
The indicator plots lines in highest highs or lowest lows from a period of "Bars", you only have to set the number of Bars you wanna use and the indicator Makes all the stuff.
This is a Long term Indicator, so it can Show useful Floors or Roofs from higher Timeframes:
Cristal = Five Min Bars
Paper = thirty Min Bars
Plastic = 1 Hour Bars
Wood = 4 hours Bars
Metal = Daily Bars
But wait... There is something better than that...
If The Floor or Roof Brokes, the indicator will plot a dashed line and a label ¨Broken Roof or Floor¨ u can use it to set a Limit Order or Stop Order, and wait for the pullback.
Do you want some useful Advice ? Check the junctions from Floor or Roofs that are overlayed in some level.
Have Fun and good trading!!!
Open-source script
In true TradingView spirit, the creator of this script has made it open-source, so that traders can review and verify its functionality. Kudos to the author! While you can use it for free, remember that republishing the code is subject to our House Rules.
Disclaimer
The information and publications are not meant to be, and do not constitute, financial, investment, trading, or other types of advice or recommendations supplied or endorsed by TradingView. Read more in the Terms of Use.