PROTECTED SOURCE SCRIPT
[DEM] Sequential Identifying Table
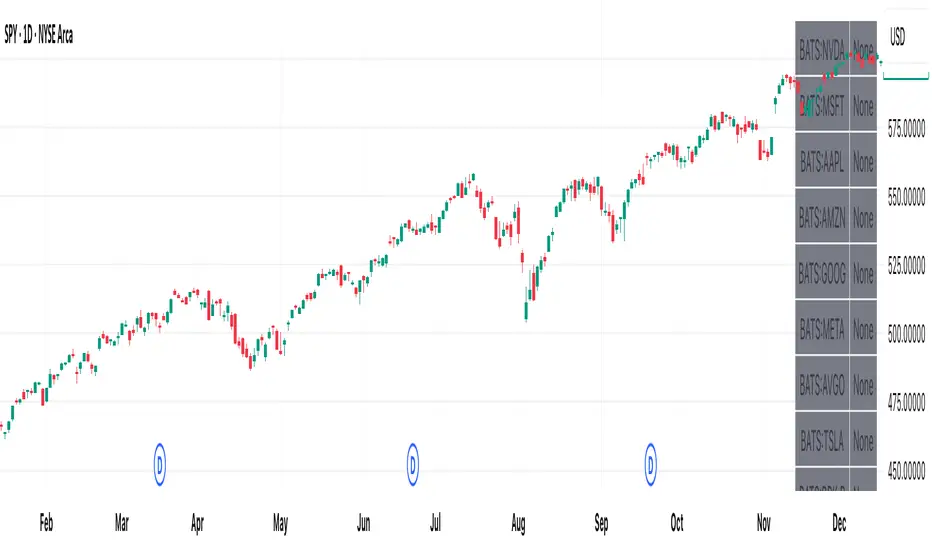
[DEM] Sequential Identifying Table is designed to monitor Sequential methodology across up to 20 customizable symbols simultaneously, displaying buy and sell signals in a comprehensive dashboard format overlaid on the price chart. The indicator implements a sequential counting system, which tracks consecutive closes above or below the close from four periods ago, generating buy signals when a downward sequence reaches 8 (indicating potential exhaustion and reversal upward) and sell signals when an upward sequence reaches 8 (indicating potential exhaustion and reversal downward). The table displays each symbol with color-coded backgrounds (green for buy signals, red for sell signals, gray for no signal) and corresponding signal text, operating on a selectable timeframe from 1-minute to monthly intervals, allowing traders to quickly scan multiple assets for sequential setups without switching between different charts or timeframes.
Protected script
This script is published as closed-source. However, you can use it freely and without any limitations – learn more here.
Disclaimer
The information and publications are not meant to be, and do not constitute, financial, investment, trading, or other types of advice or recommendations supplied or endorsed by TradingView. Read more in the Terms of Use.