OPEN-SOURCE SCRIPT
Updated Seasonality and Presidential cycle

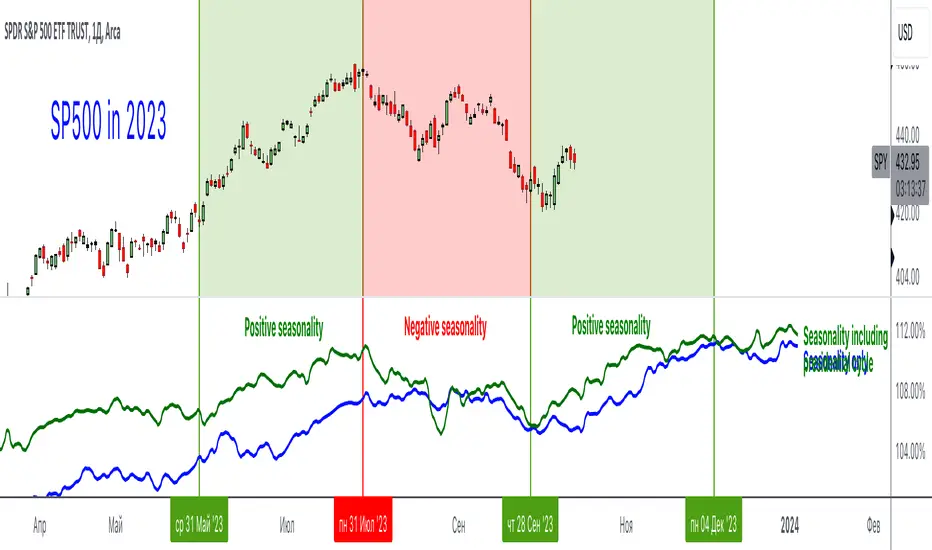
An incredibly useful indicator that shows seasonality and presidential cycles by indices, stocks and industries. Just type in a ticker and trade according to seasonal patterns
Blue line - seasonality excluding presidential cycles
Green line - seasonality taking into account presidential cycles
*Seasonal patterns over the last 10 years
This indicator uses the request.seed() function.
Requests data from a GitHub repository maintained by our team and returns it as a series.
Pine Seeds is a service to import custom data and access it via TradingView.
Use TradingView as frontend and use a GitHub repository as backend.
github.com/tradingview-pine-seeds/docs
...
Rus: Невероятно полезный индикатор, который показывает сезонность и президентские циклы по индексам, акциям и отраслям. Просто вбейте тикер и торгуйте согласно сезонным паттернам
Синяя линия - сезонность без учета президентских циклов
Зеленая линия - сезонность с учетом президентских циклов
*Сезонные паттерны за последние 10 лет
Release Notes
New demo chartRelease Notes
New chartRelease Notes
New chartRelease Notes
New chartRelease Notes
New chartRelease Notes
New chartRelease Notes
New chartRelease Notes
New chart, some bugs fixedRelease Notes
New chartRelease Notes
Bugs fixedRelease Notes
New codeRelease Notes
Data for 2024 Release Notes
More tickersRelease Notes
Monthly seasonalityRelease Notes
Seasonal patterns (new)Release Notes
Bugs fixedRelease Notes
Seasonality and Presidential cycle for 2025Release Notes
Optimized and improved loading speedOpen-source script
In true TradingView spirit, the creator of this script has made it open-source, so that traders can review and verify its functionality. Kudos to the author! While you can use it for free, remember that republishing the code is subject to our House Rules.
Disclaimer
The information and publications are not meant to be, and do not constitute, financial, investment, trading, or other types of advice or recommendations supplied or endorsed by TradingView. Read more in the Terms of Use.
Open-source script
In true TradingView spirit, the creator of this script has made it open-source, so that traders can review and verify its functionality. Kudos to the author! While you can use it for free, remember that republishing the code is subject to our House Rules.
Disclaimer
The information and publications are not meant to be, and do not constitute, financial, investment, trading, or other types of advice or recommendations supplied or endorsed by TradingView. Read more in the Terms of Use.