PROTECTED SOURCE SCRIPT
Sharad FVG (Last FVG SL/TP + Entry + % + Label Size)
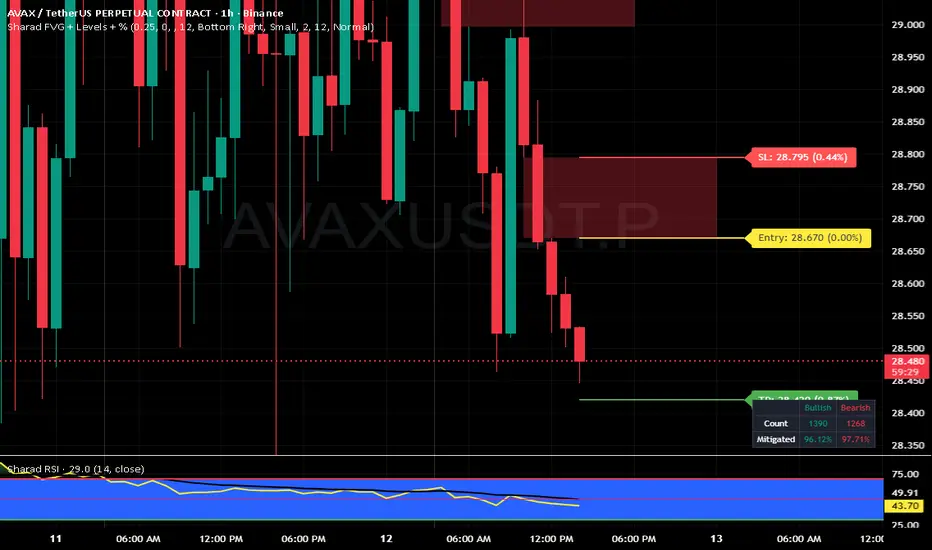
Sharad Fair Value Gap — Last FVG Entry, SL & TP (with % Labels)
What it is
A streamlined Fair Value Gap (FVG) tool that plots exact trading levels for the latest unmitigated FVG only:
Entry (yellow)
Stop-Loss (red)
Target (green) computed from a configurable Risk:Reward
Price and percentage distance printed on the right of each line
Optional dashboard and optional visualization of recent unmitigated/mitigated FVGs
The goal is simple: find the newest valid imbalance and give you just three actionable levels—no clutter.
How it detects FVGs
The script uses the standard 3-candle FVG logic (inspired by LuxAlgo’s implementation):
Bullish FVG forms when:
low > high[2] and close[1] > high[2] and the gap size exceeds the Threshold filter.
The bullish gap is between high[2] (lower bound) and low (upper bound).
Bearish FVG forms when:
high < low[2] and close[1] < low[2] and the gap size exceeds the Threshold filter.
The bearish gap is between low[2] (lower bound) and high (upper bound).
Threshold % filters small/weak gaps. You can also enable Auto, which estimates a dynamic threshold from recent candle ranges, so tiny imbalances don’t spam your chart in low-volatility regimes.
You may set Timeframe to detect FVGs on the chart timeframe or any higher/lower TF via request.security.
“Latest FVG only” levels (the core feature)
From the most recent unmitigated FVG (bullish or bearish), the script draws:
Entry
Bullish FVG → Entry = higher side of the gap (the gap max)
Bearish FVG → Entry = lower side of the gap (the gap min)
Stop-Loss (SL) = the opposite side of that same gap
Target (TP) = Entry + (Risk × R:R) for bulls, Entry − (Risk × R:R) for bears
where Risk = |Entry − SL| and R:R is your input (default 1:2)
Each line shows the price and its absolute % distance from Entry in parentheses—like TradingView’s long/short tool.
Alerts included
These are carried over from the base logic so you can build workflows:
Bullish FVG – when a new bullish gap is detected
Bearish FVG – when a new bearish gap is detected
Bullish FVG Mitigation – when a bullish gap is filled
Bearish FVG Mitigation – when a bearish gap is filled
Credits & License
Inspiration & base logic: LuxAlgo’s “Fair Value Gap [LuxAlgo]”.
This script: modified and extended by Sharad (Entry/SL/TP for latest FVG, price/% labels, label sizing, decluttered drawing).
License: This derivative keeps the original CC BY-NC-SA 4.0 license.
Attribution: Credit LuxAlgo for the original FVG approach and detection logic.
Non-Commercial: You may not use this for commercial purposes.
Share-Alike: If you remix/redistribute, you must use the same license and provide attribution.
Disclaimer:
Educational use only. Nothing in this script or its description is financial advice or a recommendation to buy/sell any asset. Markets involve substantial risk. Past performance and historical fill rates do not guarantee future results. You are solely responsible for your trading decisions and risk management. Data feeds, broker routing, spreads, slippage, and TradingView’s real-time behavior (especially with MTF) can affect outcomes. Test thoroughly on a demo account and consider multiple forms of confirmation before risking capital.
Protected script
This script is published as closed-source. However, you can use it freely and without any limitations – learn more here.
Disclaimer
The information and publications are not meant to be, and do not constitute, financial, investment, trading, or other types of advice or recommendations supplied or endorsed by TradingView. Read more in the Terms of Use.