OPEN-SOURCE SCRIPT
ATR Range Accumulation by Standard Deviation and Volume [SS]
So, this is an indicator/premise I have been experimenting with, which mixes ATR with Z-Score and Volume metrics.
What does the indicator do?
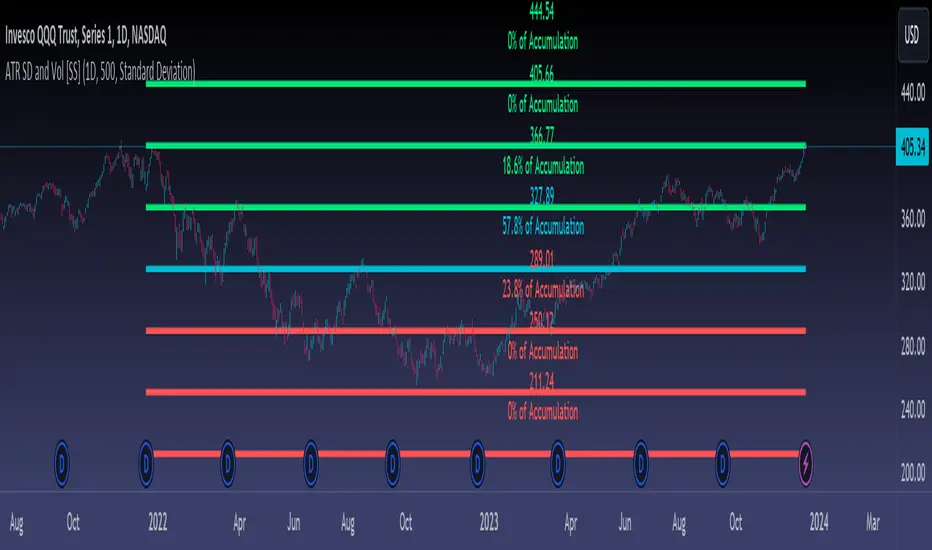
The indicator, on the lower timeframes, uses an ATR approach to determine short-term ranges. It takes the average ATR range over a designated lookback period and plots out the levels like so:

It then calculates the Z-Score for these ATR targets (shown in the chart above) and calculates, over the designated lookback period, how often price accumulates at that standard deviation level.
The indicator is essentially a hybrid of my Z-Score Support and Resistance indicator and my frequency distribution indicator. It combines both concepts into one.
You also have the option of sorting by volume accumulation. This will display the accumulation of the ranges by volume accumulation, like so:

Larger Timeframes:
If you want to see the accumulation by volume or standard deviation on the larger timeframes, you can. Simply toggle on your preferred setting:

Show Total Accumulation Breakdown:
This will break down the levels, over the lookback period, by standard deviation. This is similar to the Z-Score support and resistance indicator. It will then show you how often price accumulates at these various standard deviation levels. Here is an example on the daily timeframe using the 1D chart settings:

Inversely, you can repeat this, with the Z-Score levels, but show accumulation by volume. This will print 5 boxes, which are between +3 Standard Deviations and -3 Standard Deviations, like so:

Here we can see that 61% of volume accumulation is between -1 and 1 standard deviation.
Using it to Trade:
For swing trading, I suggest using the larger timeframe information. However, for both swing and day traders, it is also helpful to use the ATR display. You can modify the ATR display to show the levels on any timeframe by selecting which timeframe you would like to see ATR ranges for. If you are trading on the 1 or 5-minute chart, I suggest leaving the levels at no shorter than a 60-minute timeframe.
You can also use these levels on the daily for the weekly levels, etc.
The accumulation being shown will be based on the current chart timeframe. This is a function of Pinescript, but in this case, it's actually advantageous because if you are trading on the shorter timeframe, and a level has 0% recent accumulation, it's unlikely we will see that level soon or overly quickly. Intraday retracements will generally happen to areas of high accumulation.
How this indicator is different:
The difference in this indicator comes from its focus on accumulation in relation to Standard Deviation. There is one thing that is consistent among retail traders, algorithms, market makers, and funds, and that is looking at the market in terms of standard deviation. Each person, market maker, and algorithm may be slightly nuanced in how it conceptualizes standard deviation (whether it be since the inception of the ticker (or IPO), or the previous 500 days, or the previous 100 days, etc.), but the premise remains consistent. Standard Deviation is a really important, if not the most important, metric to pay attention to. Another important metric is volume. Thus, the premise is that combining volume accumulation with standard deviation should, theoretically, be telling. We can see the extent of buying at various standard deviations and whether a stock is really a buy or not.
And that's the indicator! Hope you enjoy it. Leave your comments and questions below.
Safe trades!
What does the indicator do?
The indicator, on the lower timeframes, uses an ATR approach to determine short-term ranges. It takes the average ATR range over a designated lookback period and plots out the levels like so:
It then calculates the Z-Score for these ATR targets (shown in the chart above) and calculates, over the designated lookback period, how often price accumulates at that standard deviation level.
The indicator is essentially a hybrid of my Z-Score Support and Resistance indicator and my frequency distribution indicator. It combines both concepts into one.
You also have the option of sorting by volume accumulation. This will display the accumulation of the ranges by volume accumulation, like so:
Larger Timeframes:
If you want to see the accumulation by volume or standard deviation on the larger timeframes, you can. Simply toggle on your preferred setting:
Show Total Accumulation Breakdown:
This will break down the levels, over the lookback period, by standard deviation. This is similar to the Z-Score support and resistance indicator. It will then show you how often price accumulates at these various standard deviation levels. Here is an example on the daily timeframe using the 1D chart settings:
Inversely, you can repeat this, with the Z-Score levels, but show accumulation by volume. This will print 5 boxes, which are between +3 Standard Deviations and -3 Standard Deviations, like so:
Here we can see that 61% of volume accumulation is between -1 and 1 standard deviation.
Using it to Trade:
For swing trading, I suggest using the larger timeframe information. However, for both swing and day traders, it is also helpful to use the ATR display. You can modify the ATR display to show the levels on any timeframe by selecting which timeframe you would like to see ATR ranges for. If you are trading on the 1 or 5-minute chart, I suggest leaving the levels at no shorter than a 60-minute timeframe.
You can also use these levels on the daily for the weekly levels, etc.
The accumulation being shown will be based on the current chart timeframe. This is a function of Pinescript, but in this case, it's actually advantageous because if you are trading on the shorter timeframe, and a level has 0% recent accumulation, it's unlikely we will see that level soon or overly quickly. Intraday retracements will generally happen to areas of high accumulation.
How this indicator is different:
The difference in this indicator comes from its focus on accumulation in relation to Standard Deviation. There is one thing that is consistent among retail traders, algorithms, market makers, and funds, and that is looking at the market in terms of standard deviation. Each person, market maker, and algorithm may be slightly nuanced in how it conceptualizes standard deviation (whether it be since the inception of the ticker (or IPO), or the previous 500 days, or the previous 100 days, etc.), but the premise remains consistent. Standard Deviation is a really important, if not the most important, metric to pay attention to. Another important metric is volume. Thus, the premise is that combining volume accumulation with standard deviation should, theoretically, be telling. We can see the extent of buying at various standard deviations and whether a stock is really a buy or not.
And that's the indicator! Hope you enjoy it. Leave your comments and questions below.
Safe trades!
Open-source script
In true TradingView spirit, the creator of this script has made it open-source, so that traders can review and verify its functionality. Kudos to the author! While you can use it for free, remember that republishing the code is subject to our House Rules.
Get:
- Live Updates,
- Discord access,
- Access to my Proprietary Merlin Software,
- Access to premium indicators,
patreon.com/steversteves
Now on X!
- Live Updates,
- Discord access,
- Access to my Proprietary Merlin Software,
- Access to premium indicators,
patreon.com/steversteves
Now on X!
Disclaimer
The information and publications are not meant to be, and do not constitute, financial, investment, trading, or other types of advice or recommendations supplied or endorsed by TradingView. Read more in the Terms of Use.