OPEN-SOURCE SCRIPT
Ichimoku Analysis Tool by TheSocialCryptoClub
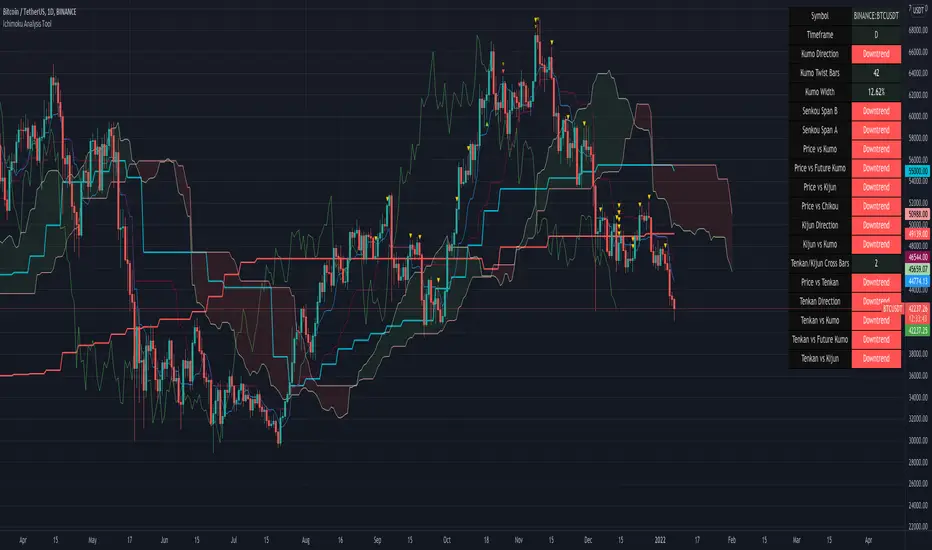
Name: Ichimoku Analysis Tool
Category: Indicator.
Timeframe: Any Timeframe
Description: Ichimoku Analysis Tool is an assistant for the trader to visualize the information that can be perceived at a glance from the Ichimoku Kinko Hyo indicator.
Suggested usage: Use on Daily to evaluate the general long term, short term and mid term situation.
Technical Details: Each cell of the table describes an element of the Ichimoku by simply assessing the direction of the lines - or whether they are flat - and how they are positioned with each other (e.g. Tenkan above or below the Kijun) and in general how long ago the last Kumo Twist was and the width in percent of the Kumo.
Credits:
- Some of the indications has been explained by Corrado Rondelli
- Table has been inspired by tanayroy's ICHIMOKU Trading beta
Open-source script
In true TradingView spirit, the creator of this script has made it open-source, so that traders can review and verify its functionality. Kudos to the author! While you can use it for free, remember that republishing the code is subject to our House Rules.
- Scalping The Bull Indicator: linktr.ee/scalpingthebull
- Scalping The Bull Training: tinyurl.com/corsoindicatorepro
- AlgoTrading Training: tiny.one/corsopinescriptbase
- Crypto News: t.me/joinchat/StkXJM
- Scalping The Bull Training: tinyurl.com/corsoindicatorepro
- AlgoTrading Training: tiny.one/corsopinescriptbase
- Crypto News: t.me/joinchat/StkXJM
Disclaimer
The information and publications are not meant to be, and do not constitute, financial, investment, trading, or other types of advice or recommendations supplied or endorsed by TradingView. Read more in the Terms of Use.