OPEN-SOURCE SCRIPT
RSI Curl Signals 70 / 60 / 40
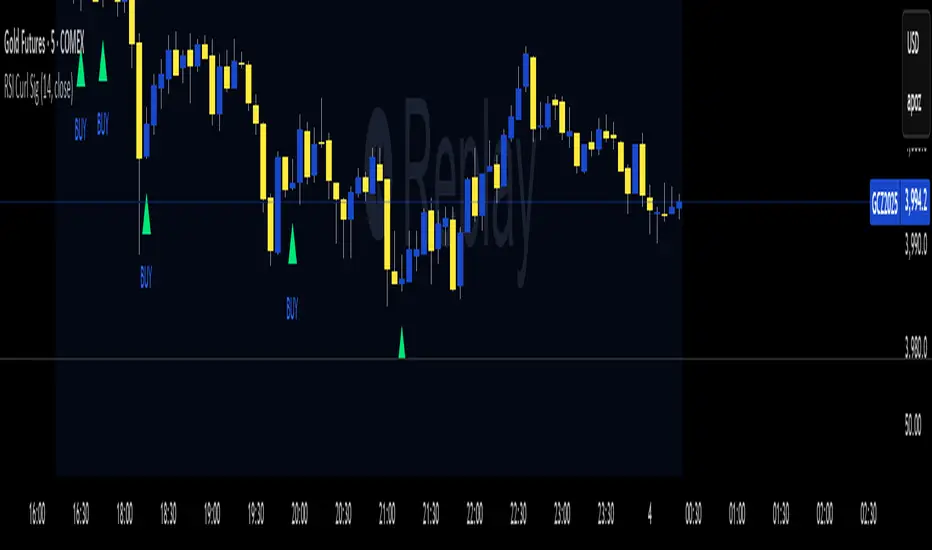
This Indicator Identifies the turning points on the RSI and plots a buy and sell signal on the chart It plots on crossing up above the 41 Level on the RSI and plots a sell curling below the 60 level use a standard RSI on chart if needed with alerts set at RSI curling up above value 40 Level and use an alert for curling below Level 60 use support and resistance for confirmation
Works with any timeframe Ans any asset
Works with any timeframe Ans any asset
Open-source script
In true TradingView spirit, the creator of this script has made it open-source, so that traders can review and verify its functionality. Kudos to the author! While you can use it for free, remember that republishing the code is subject to our House Rules.
Disclaimer
The information and publications are not meant to be, and do not constitute, financial, investment, trading, or other types of advice or recommendations supplied or endorsed by TradingView. Read more in the Terms of Use.