The Trending Band Indicator
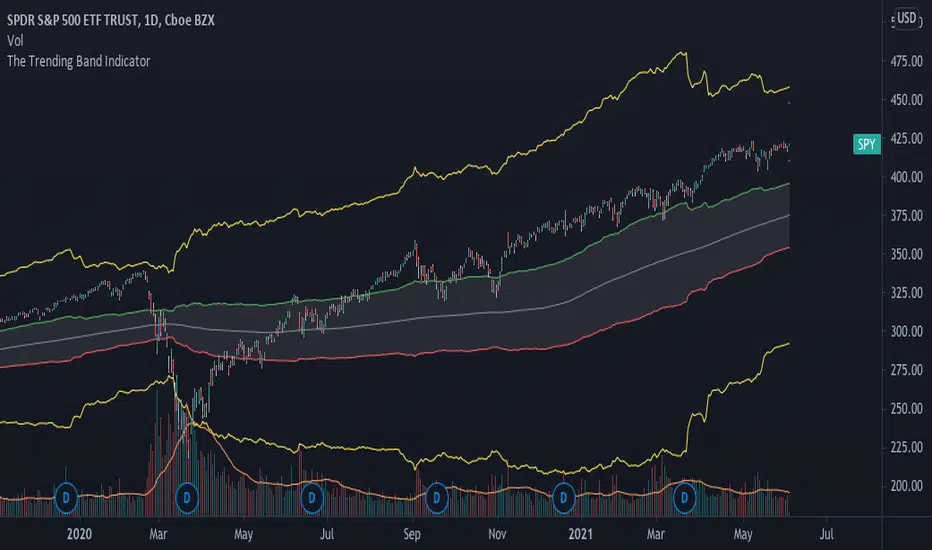
The top most and bottom most yellow lines are 4 standard deviations of historical volatility which give an idea of where the floor and ceiling are. This helps investors and traders identify good buy and sell zones using the yellow lines to see overbought and oversold sides.
This is a great indicator for people who need help following the trend of a stock, etf , etc.
Invite-only script
Only users approved by the author can access this script. You'll need to request and get permission to use it. This is typically granted after payment. For more details, follow the author's instructions below or contact tenpercentcreditspreads directly.
TradingView does NOT recommend paying for or using a script unless you fully trust its author and understand how it works. You may also find free, open-source alternatives in our community scripts.
Author's instructions
Disclaimer
Invite-only script
Only users approved by the author can access this script. You'll need to request and get permission to use it. This is typically granted after payment. For more details, follow the author's instructions below or contact tenpercentcreditspreads directly.
TradingView does NOT recommend paying for or using a script unless you fully trust its author and understand how it works. You may also find free, open-source alternatives in our community scripts.