OPEN-SOURCE SCRIPT
Updated Volume Profile

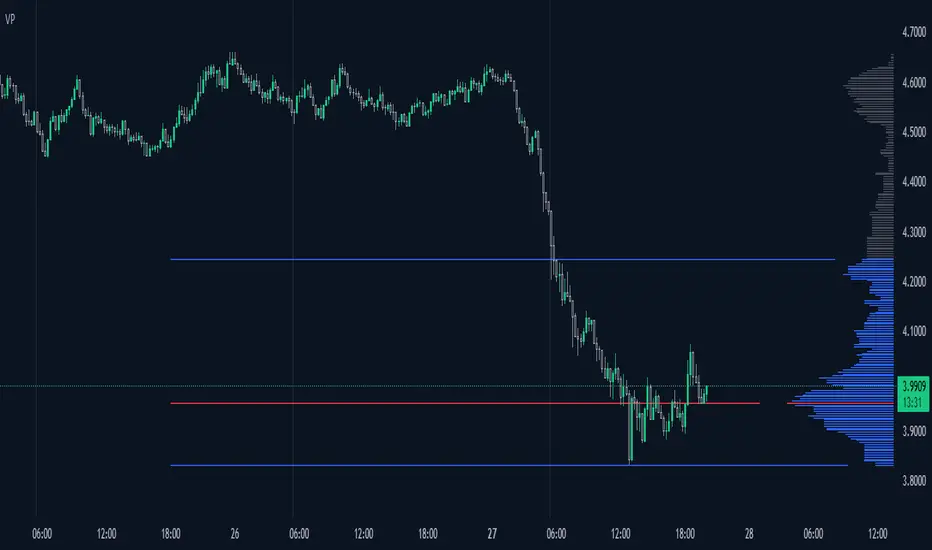
This is a Volume Profile based on pine script arrays.
The main idea behind this script is from the user IldarAkhmetgaleev[script: Poor man's volume profile].
He created an awesome piece of code for free users on tradingview.
Here are some changes to the main script:
0. Used Pine Script Arrays for doing/storing calculations.
1. The bar labels are replaced with lines.
2. Added a POC line.
3. Bar growing directions changed from right to left.
4. Added an option to change bar width.
Inputs:
0. Volume Lookback Depth [10-1000] : Number of bars to look back for volume calculations.
1. Bar Length Multiplier [10-100] : Bar length multiplier to make bar long or short.
2. Bar Horizontal Offset [0-100] : Horizontal distance from the current bar in the right direction.
3. Bar Width [1-20] : Width of the bars.
4. Show POC Line : Show or hide the POC line.
Happy trading.
Release Notes
Added option for changing Bar and POC line colors.Release Notes
According to the latest update from the Tradingview, now we can define number of drawable lines in the study parameter as 'max_lines_count' up to the 500.So here are our Volume Profile script with updated features.
Changes:
1. Added option for setting number of bars from 10 to 500.
2. Codes cleaned little bit.
Release Notes
Added delta option as suggested by @NXT2017.Options: Both, Bullish and Bearish.
Both: bullish and bearish both candles ae used to calculate volume profile (default).
Bullish: only bullish candles are used.
Bearish: only bearish candles are used.
Release Notes
For viewing delta in volume profile, add this indicator two times and set delta type to bullish on the first one and bearish on the second one, now set same bar numbers on both.Release Notes
👍Release Notes
Range Selection Enhancement: Added support for visible bars range mode, which dynamically detects the visible candles/bars on the current chart to calculate the volume profile. This means the volume profile adjusts automatically as you zoom in or out. Additionally, a fixed range option is available, configurable in the settings menu.Value Area Feature: Introduced the Value Area functionality, highlighting 68% of the traded volume by default.
Terminology Update: Renamed "Delta Type" to "Volume Type" for improved clarity, as the feature deals with volume rather than delta.
General Improvements: Applied minor refinements to enhance performance and user experience.
Happy trading ✌️
Release Notes
- Minor improvements and optimizations.- Updated "Lookback Period" to a "Fixed Range" configuration, aligning with the previous version.
Happy trading! ✌️
Open-source script
In true TradingView spirit, the creator of this script has made it open-source, so that traders can review and verify its functionality. Kudos to the author! While you can use it for free, remember that republishing the code is subject to our House Rules.
Disclaimer
The information and publications are not meant to be, and do not constitute, financial, investment, trading, or other types of advice or recommendations supplied or endorsed by TradingView. Read more in the Terms of Use.