OPEN-SOURCE SCRIPT
PE Range
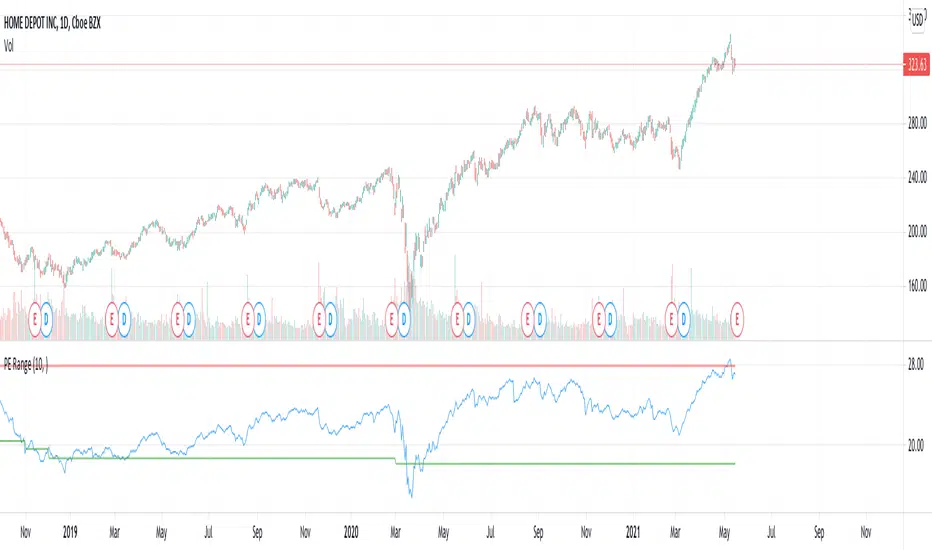
Here is an attempt to mix fundamentals with technicals.
Study plots PE ratio on charts. We also plot historical max and min PE ratio based on loopback years input.
Apparently, tradingview has capability to get historical financials into charts and make use of them in our trading strategies.
tradingview.com/?solution=43000564727
Will be exploring them further.
Open-source script
In true TradingView spirit, the creator of this script has made it open-source, so that traders can review and verify its functionality. Kudos to the author! While you can use it for free, remember that republishing the code is subject to our House Rules.
Trial - trendoscope.io/trial
Subscribe - trendoscope.io/pricing
Blog - docs.trendoscope.io
Subscribe - trendoscope.io/pricing
Blog - docs.trendoscope.io
Disclaimer
The information and publications are not meant to be, and do not constitute, financial, investment, trading, or other types of advice or recommendations supplied or endorsed by TradingView. Read more in the Terms of Use.