MRT, Barcolor for Trend Direction
1- This is
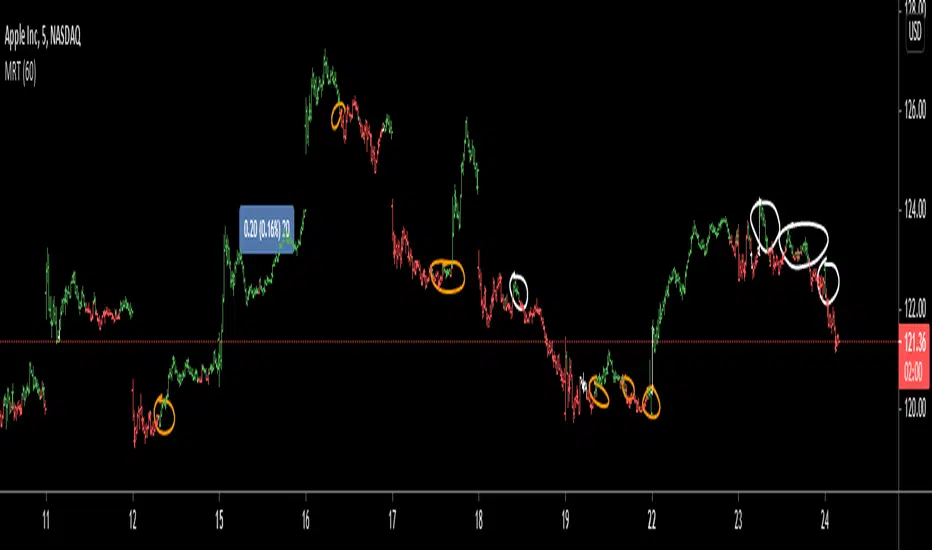
A-Yellow Circles on the chart: Green is a Buy ,Red is a Sell
B-The white bars are transition to to the opposite color (red to green or vic versa ) it can serve as a warning of trend change.
C-As with any signal , sometimes it is a false signal (the white circles you see there). However, I would stick to the signal each time it changes.
2-The indicator uses previous highs and lows based on different time frames that you select. and calculate the winners and losers.
3-
A-I personally choose shorter time frame ( Hour, 30 minutes, even 1 minute) because I want faster signals to trade short term.
B-However, you can use it for longer term if you trade on longer time frames.
c-Whatever timeframe you use , choose lower for the candle; For example, if you use the One-Hour for the indicator then apply it to the five minutes chart. I use the 30 seconds chart.
4-This indicator will not guarantee any returns.
comment if you have any question.
Invite-only script
Only users approved by the author can access this script. You'll need to request and get permission to use it. This is typically granted after payment. For more details, follow the author's instructions below or contact malrawi directly.
TradingView does NOT recommend paying for or using a script unless you fully trust its author and understand how it works. You may also find free, open-source alternatives in our community scripts.
Author's instructions
Disclaimer
Invite-only script
Only users approved by the author can access this script. You'll need to request and get permission to use it. This is typically granted after payment. For more details, follow the author's instructions below or contact malrawi directly.
TradingView does NOT recommend paying for or using a script unless you fully trust its author and understand how it works. You may also find free, open-source alternatives in our community scripts.