OPEN-SOURCE SCRIPT
Updated Aroon Oscillator [bkeevil]
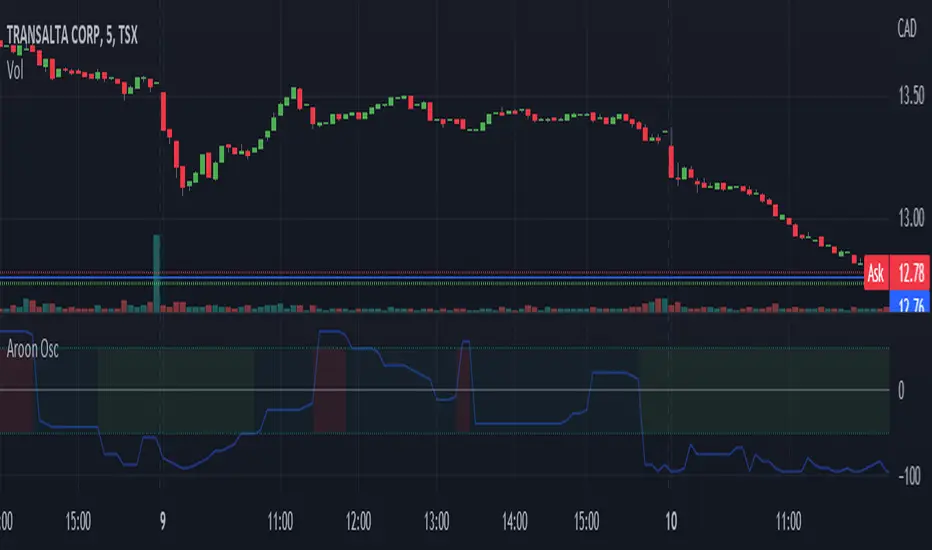
The Aroon Oscillator is intended to highlight short-term trend changes by comparing the number of periods since the last high with the number of periods since the last low.
Since the crossover rules for this oscillator frequently give false signals, I have opted for a more general approach: When the oscillator passes above the 50 line, the background of the indicator will turn green, indicating a general short term buy condition. When the oscillator passes below the -50 line, the background of the indicator will turn red, indicating a general short term sell condition. Use this indicator in combination with other indicators and price signals to identify short term trend changes.
This version improves on existing versions by:
- Adding background colors to indicate general buy/sell conditions
- More visually appealing
- Uses the latest version 5 features
- Well documented source code that conforms to the style guide
Release Notes
- Turn off indicator overlay mode
- Fix erroneous tooltip
Release Notes
- Changed the rendering of horizontal lines to use hline() instead of plot()
- Rename Buy/Sell to Uptrend/Downtrend
Open-source script
In true TradingView spirit, the creator of this script has made it open-source, so that traders can review and verify its functionality. Kudos to the author! While you can use it for free, remember that republishing the code is subject to our House Rules.
Disclaimer
The information and publications are not meant to be, and do not constitute, financial, investment, trading, or other types of advice or recommendations supplied or endorsed by TradingView. Read more in the Terms of Use.