OPEN-SOURCE SCRIPT
Updated One For All - xMAs : wave ribbon + trend strenght + xMAcross
This script is not intended to bring anything new or original, but mainly for educational purposes and aesthetic visualization of 10 moving average behavior.
Main features :
Also it is designed to be easily customizeable as the settings allow to:
Trend Strenght explanation :
Overall, this means that the opacity of the triangles represent trend strenght and a fading trend is shown by the color fading into a translucid orange color
p.s. : If you would like to see some other MA calculation method included, please comment below, I'd be happy to update this script
Main features :
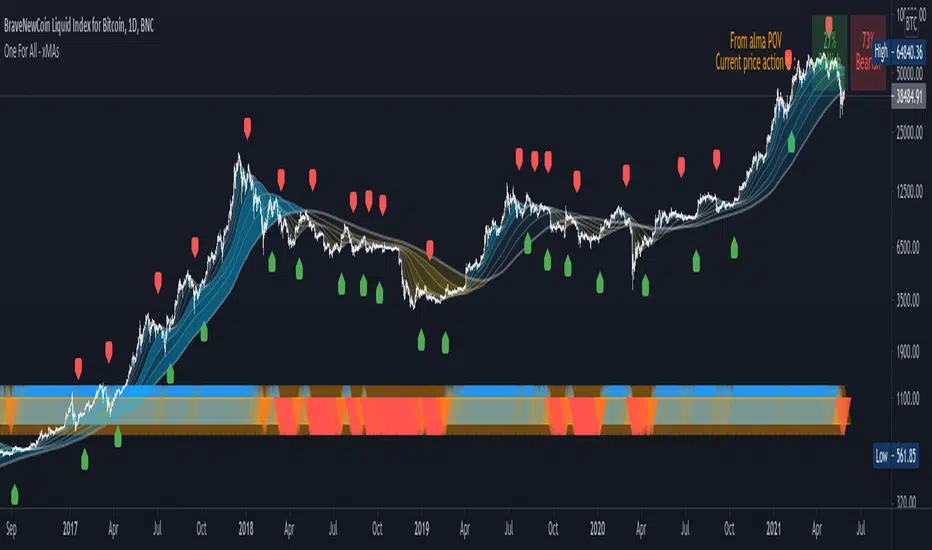
- Moving Averages : as shown by the wave ribbon (the gradient colored areas opacity is correlated with the distance from the Nth xMA to the last xMA)
- Trend Strenght : as shown by the blue/orange/red triangle shape plotted at the bottom of the chart
- Moving Average Cross Signal : as shown by the labels green LabelUp and red LabelDown
Also it is designed to be easily customizeable as the settings allow to:
- Chose different smoothing method for the 10 xMAs plotted
- Manually setup the length of each xMA or simply select a predefined list of convenient length
- Choose different MA length not only for crossover but also for crossunder
Trend Strenght explanation :
- When all the "fast xMA" are above "slow xMA" there is an opaque Blue UpTriangle plotted at bottom (bull trend)
- As more "fast xMA" fall/cross below "slow xMA", the Blue UpTriangle will start fading to a translucid orange UpTriangle
- As even more "fast xMA" fall/cross below "slow xMA", a Red DownTriangle is plotted insteand and become more and more opaque as more MA fall below others
Overall, this means that the opacity of the triangles represent trend strenght and a fading trend is shown by the color fading into a translucid orange color
p.s. : If you would like to see some other MA calculation method included, please comment below, I'd be happy to update this script
Release Notes
- Adding the Pine Table feature to display the current Bulls & Bears presence on the battlefield, and also remind of the smoothing method used. This helps explicit the current trend strength better than opacity of the TriangleUp/Down heatmap displayed at bottom, which remains to help assess historic trend evolution.
- Adding some comments to explicit some functions/blocks
p.s.: tbh, the main reason for this update was originally to change a horrible typo on the title
Open-source script
In true TradingView spirit, the creator of this script has made it open-source, so that traders can review and verify its functionality. Kudos to the author! While you can use it for free, remember that republishing the code is subject to our House Rules.
Disclaimer
The information and publications are not meant to be, and do not constitute, financial, investment, trading, or other types of advice or recommendations supplied or endorsed by TradingView. Read more in the Terms of Use.