OPEN-SOURCE SCRIPT
AlgoPilotX – FibFusion Confluence PRO

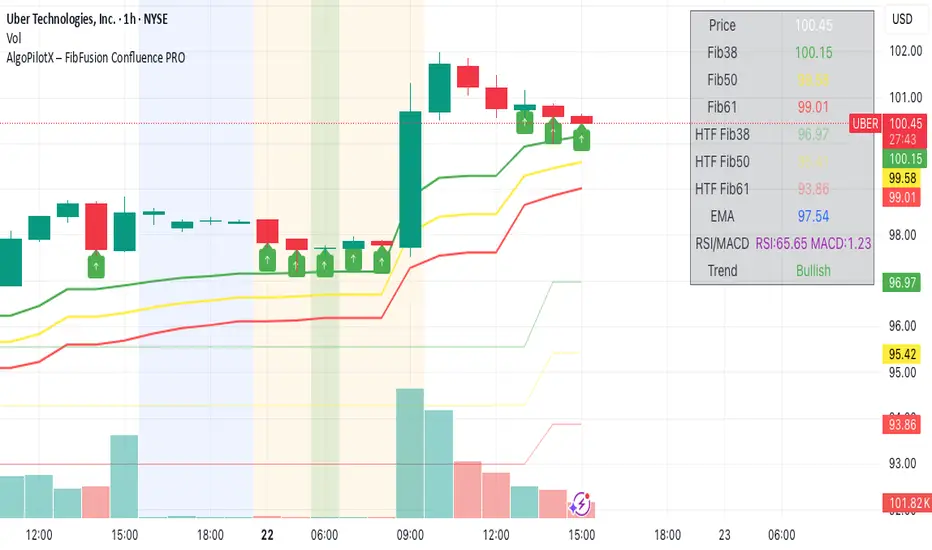
Take your Fibonacci trading to the next level with AlgoPilotX – FibFusion Confluence PRO. This advanced TradingView indicator combines multi-timeframe Fibonacci retracements with key technical indicators to identify high-probability trading zones.
Features:
Detects TF and Higher Timeframe (HTF) Fibonacci levels automatically.
Highlights Fib confluence zones with background colors for bullish and bearish probabilities.
Displays arrows on exact Fib touches for quick visual cues.
Integrated EMA, RSI, and MACD analysis to improve trend accuracy.
Dynamic Trend Indicator: Bullish, Bearish, or Neutral.
Interactive dashboard showing all key levels and indicators in real-time with intuitive color coding.
Supports multiple chart timeframes and recalculates trend and confluence dynamically.
Alerts for high probability bullish or bearish zones, ready to integrate into your trading strategy.
How to Use:
Observe price approaching Fibonacci levels displayed as lines and arrows.
Confluence Zones:
Green background: High-probability bullish zone.
Red background: High-probability bearish zone.
Neutral: No strong confluence.
Confirm signals using EMA, RSI, and MACD.
Use the dashboard to track all key levels, multi-timeframe Fibs, and current Trend.
Enter trades near high-probability confluence zones and manage risk accordingly.
Perfect for swing traders, day traders, and anyone using Fibonacci retracements to find precise entry and exit points.
Open-source script
In true TradingView spirit, the creator of this script has made it open-source, so that traders can review and verify its functionality. Kudos to the author! While you can use it for free, remember that republishing the code is subject to our House Rules.
Disclaimer
The information and publications are not meant to be, and do not constitute, financial, investment, trading, or other types of advice or recommendations supplied or endorsed by TradingView. Read more in the Terms of Use.