OPEN-SOURCE SCRIPT
Z-Score
Description:
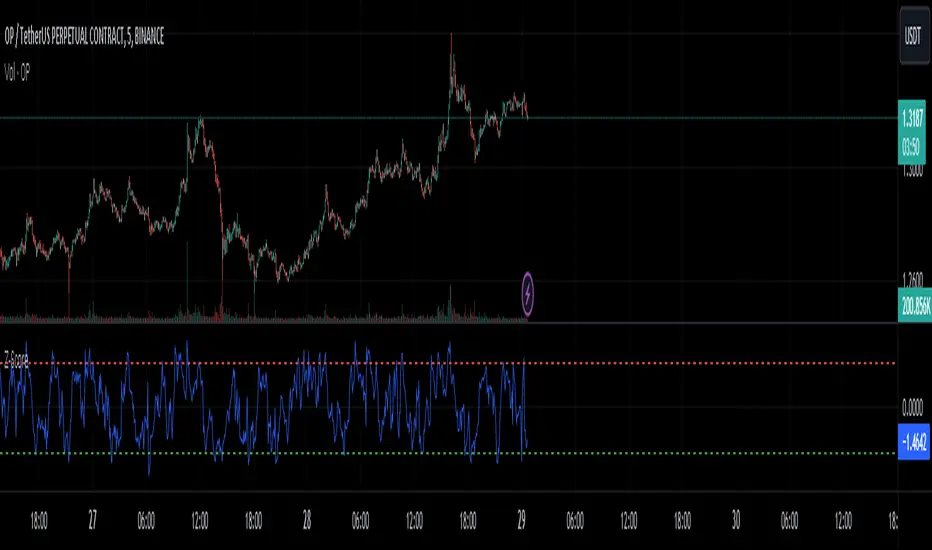
The Z-Score indicator is a powerful tool for assessing the relative position of a financial instrument's current price compared to its historical price data. It calculates the Z-Score, which is a statistical measure of how many standard deviations an asset's current price is away from its historical mean. This can help traders identify overbought and oversold conditions in the market.
Input Parameters:
Length: This parameter sets the look-back period for calculating the mean and standard deviation. It is set to 20 by default but can be adjusted according to your trading preferences.
How it works:
The indicator first calculates the mean (average) and standard deviation of the selected price source (default: closing prices) over the specified length.
The Z-Score is then computed by measuring how many standard deviations the current price is away from the mean. This value is plotted on the chart, providing insight into the current price's relative position.
Usage:
Overbought: When the Z-Score rises above the upper threshold (e.g., +2 standard deviations, shown in red), it suggests that the asset's price is significantly above its historical average, indicating a potential overbought condition. Traders might consider this as a signal to be cautious about entering long positions or to look for potential short opportunities.
Oversold: Conversely, when the Z-Score falls below the lower threshold (e.g., -2 standard deviations, shown in green), it suggests that the asset's price is significantly below its historical average, indicating a potential oversold condition. Traders might consider this as a signal to be cautious about entering short positions or to look for potential long opportunities.
The Z-Score indicator can be a valuable addition to your technical analysis toolkit, helping you make informed trading decisions based on statistical price deviations.
Please make sure to conduct thorough backtesting and combine this indicator with other analysis techniques before making any trading decisions.
Open-source script
In true TradingView spirit, the creator of this script has made it open-source, so that traders can review and verify its functionality. Kudos to the author! While you can use it for free, remember that republishing the code is subject to our House Rules.
Disclaimer
The information and publications are not meant to be, and do not constitute, financial, investment, trading, or other types of advice or recommendations supplied or endorsed by TradingView. Read more in the Terms of Use.