AlphaBTC - Long Term Trend Probability Indicator on Bitcoin
AlphaBTC is a consensus-based long-term trend probability indicator designed specifically for Bitcoin and cryptocurrency markets. It combines 9 independent trend detection methodologies into a single probabilistic score ranging from -1 (strong bearish) to +1 (strong bullish). Unlike single-indicator systems that can produce frequent false signals, AlphaBTC requires agreement across multiple analytical frameworks before generating directional signals.
METHODOLOGY - THE 9-INDICATOR CONSENSUS MODEL
Each indicator analyzes trend from a different mathematical perspective, providing a binary vote: +1 (bullish), -1 (bearish), or 0 (neutral). The average of all 9 votes creates the final probability score.
1. AADTREND (Average Absolute Deviation Trend)
Method: Calculates average absolute deviation from a moving average using 7 different MA types (SMA, EMA, HMA, DEMA, TEMA, RMA, FRAMA)
Logic: Price crossovers above/below AAD-adjusted bands signal trend changes
Purpose: Adapts to varying market volatility conditions
2. GAUSSIAN SMOOTH TREND (GST)
Method: Multi-stage smoothing using DEMA → Gaussian Filter → SMMA → Standard Deviation bands
Logic: Long when price > (SMMA + SDmultiplier), Short when price < (SMMA - SDmultiplier)
Purpose: Removes high-frequency noise while preserving trend structure
3. RTI (RELATIVE TREND INDEX)
Method: Percentile-based ranking system comparing current price to historical upper/lower trend boundaries
Logic: Generates 0-100 index score; >80 = bullish, <20 = bearish
Purpose: Identifies price position within statistical distribution
4. HIGHEST-LOWEST DEVIATIONS TREND
Method: Dual moving average system (100/50 periods) with dynamic standard deviation bands
Logic: Compares highest and lowest boundaries from both MAs to determine trend extremes
Purpose: Identifies breakouts from multi-timeframe volatility envelopes
5. 25-75 PERCENTILE SUPERTREND
Method: Modified SuperTrend using 25th and 75th percentile bands instead of simple highs/lows
Logic: ATR-based trailing stop system anchored to percentile boundaries
Purpose: More stable trend following by filtering outlier price spikes
6. TS VOLATILITY-ADJUSTED EWMA
Method: Exponentially Weighted Moving Average with dynamic period adjustment based on ATR
Logic: Speeds up during high volatility, slows during low volatility
Purpose: Adaptive responsiveness to changing market conditions
7. NORMALIZED KAMA OSCILLATOR
Method: Kaufman Adaptive Moving Average normalized to 0-centered oscillator
Logic: Uses Efficiency Ratio to adjust smoothing constant; >0 = bullish, <0 = bearish
Purpose: Adapts to both trending and ranging markets automatically
8. EHLERS MESA ADAPTIVE MOVING AVERAGE (EMAMA)
Method: John Ehlers' MAMA/FAMA system using Hilbert Transform for cycle period detection
Logic: MAMA crossover FAMA = bullish, crossunder = bearish
Purpose: Advanced DSP-based trend detection with phase-based adaptation
9. EMA Z-SCORE
Method: Statistical z-score applied to EMA values over lookback period
Logic: >1.0 standard deviation = bullish, <0.0 = bearish
Purpose: Identifies statistically significant trend deviations
AGGREGATION METHODOLOGY
Scoring System:
Each indicator produces: +1 (bullish), -1 (bearish), or 0 (neutral)
Total score = sum of all 9 indicators (-9 to +9)
Average score = total / 9 (displayed as -1.00 to +1.00)
Signal Interpretation:
+0.50 to +1.00: STRONG BULLISH (majority consensus)
+0.30 to +0.50: MODERATE BULLISH
-0.30 to +0.30: WEAK/NEUTRAL (mixed signals)
-0.50 to -0.30: MODERATE BEARISH
-1.00 to -0.50: STRONG BEARISH (majority consensus)
Bar Coloring:
Cyan bars: Bullish consensus (score > 0)
Magenta bars: Bearish consensus (score < 0)
WHY THIS APPROACH WORKS
Traditional Single-Indicator Problems:
Overfitting to specific market conditions
High false signal rates during consolidation
No mechanism for confidence measurement
AlphaBTC Multi-Consensus Solution:
Diversification: 9 uncorrelated methodologies reduce individual indicator bias
Robustness: Requires majority agreement before signaling (prevents whipsaws)
Adaptability: Mix of momentum, volatility, and statistical indicators captures multiple market regimes
Confidence Measurement: Score magnitude indicates signal strength
Why These 9 Specific Indicators:
AADTrend - Volatility adaptation
GST - Noise filtering
RTI - Statistical positioning
HL Deviations - Multi-timeframe breakouts
Percentile ST - Robust trend following
Volatility EWMA - Dynamic responsiveness
KAMA - Efficiency-based adaptation
EMAMA - Cycle-period awareness
EMA Z-Score - Statistical confirmation
This combination covers:
Trend following (ST, EWMA, KAMA, EMAMA)
Volatility adaptation (AAD, GST, HL Dev, EWMA)
Statistical validation (RTI, Z-Score)
Adaptive smoothing (KAMA, EMAMA, Gaussian)
No single indicator covers all these bases. The ensemble approach creates a more reliable system.
VISUAL COMPONENTS
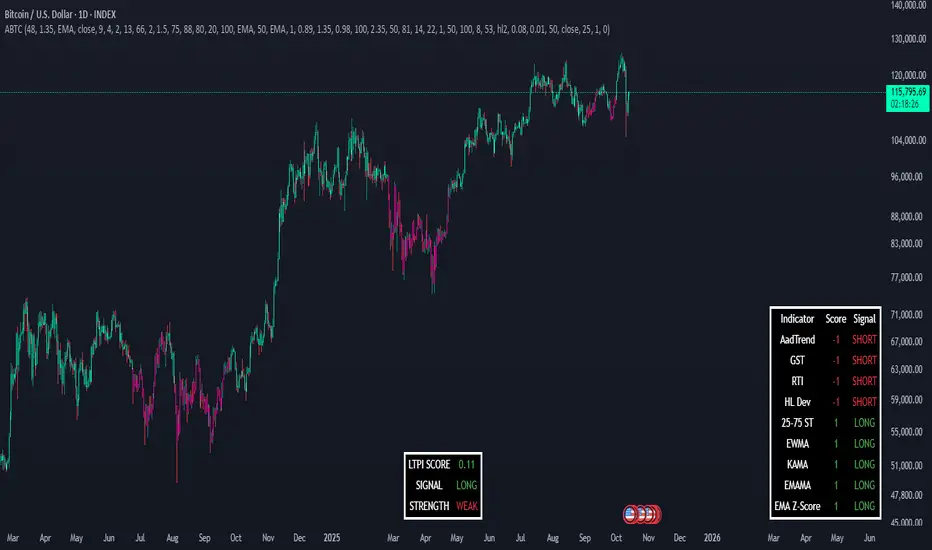
1. Score Table (Bottom Right):
Shows all 9 individual indicator scores
Color-coded: Green (bullish), Red (bearish), Gray (neutral)
Individual signals visible for transparency
2. Main Score Display (Bottom Center):
LTPI SCORE: The averaged consensus (-1.00 to +1.00)
SIGNAL: Current directional bias (LONG/SHORT)
STRENGTH: Signal confidence (STRONG/MODERATE/WEAK)
3. Bar Coloring:
Visual trend indication directly on price bars
Cyan = bullish consensus
Magenta = bearish consensus
HOW TO USE
For Long-Term Position Trading (Recommended):
Wait for average score to cross above 0 for long entries
Exit when score crosses below 0 or reverses to negative territory
Use STRENGTH indicator - only trade STRONG or MODERATE signals
For Trend Confirmation:
Use AlphaBTC as confluence with your existing strategy
Enter trades only when AlphaBTC agrees with your analysis
Avoid counter-trend trades when consensus is strong (|score| > 0.5)
Risk Management:
STRONG signals (|score| > 0.5): Full position size
MODERATE signals (0.3-0.5): Reduced position size
WEAK signals (< 0.3): Avoid trading or use for exits only
Best Timeframes:
1D chart: Primary trend identification for swing/position trading
4H chart: Intermediate trend for multi-day holds
1H chart: Short-term trend for active trading
Not Recommended:
Scalping (too many indicators create lag)
Timeframes < 1H (designed for longer-term trends)
SETTINGS EXPLAINED
Each of the 9 indicators has customizable parameters in its dedicated settings group:
AadTrend Settings:
Average Length (48): Base period for deviation calculation
AAD Multiplier (1.35): Band width adjustment
Average Type: Choose from 7 different MA types
GST Settings:
DEMA Length (9), Gaussian Length (4), SMMA Length (13)
SD Length (66): Standard deviation lookback
Multipliers for upper/lower bands
RTI Settings:
Trend Length (75): Historical data points for boundary calculation
Sensitivity (88%): Percentile threshold
Long/Short Thresholds (80/20): Entry trigger levels
HL Deviations Settings:
Dual MA system (100/50 periods)
Separate deviation coefficients for upper/lower bands
25-75 Percentile ST Settings:
SuperTrend Length (100)
Multiplier (2.35)
Percentile Length (50)
EWMA Settings:
Length (81), ATR Lookback (14)
Volatility Factor (1.0) for dynamic adjustment
KAMA Settings:
Fast/Slow Periods (50/100)
Efficiency Ratio Period (8)
Normalization Lookback (53)
EMAMA Settings:
Fast/Slow Limits (0.08/0.01) for cycle adaptation
EMA Z-Score Settings:
EMA Length (50)
Lookback Period (25)
Threshold levels for long/short signals
ALERTS
Four alert conditions available:
LTPI Long Signal: When average score crosses above 0
LTPI Short Signal: When average score crosses below 0
LTPI Long: Any bar with bullish consensus
LTPI Short: Any bar with bearish consensus
IMPORTANT NOTES
This is a CONSENSUS indicator - it shows probability, not prediction
Designed for Bitcoin
Best for long-term trend identification (days to weeks, not minutes to hours)
Lagging by design - prioritizes accuracy over speed
Not a standalone strategy - use with proper risk management and position sizing
Requires minimum 100+ bars of historical data for proper indicator calculation
Invite-only script
Only users approved by the author can access this script. You'll need to request and get permission to use it. This is typically granted after payment. For more details, follow the author's instructions below or contact AlphaEdge_ directly.
TradingView does NOT recommend paying for or using a script unless you fully trust its author and understand how it works. You may also find free, open-source alternatives in our community scripts.
Author's instructions
Disclaimer
Invite-only script
Only users approved by the author can access this script. You'll need to request and get permission to use it. This is typically granted after payment. For more details, follow the author's instructions below or contact AlphaEdge_ directly.
TradingView does NOT recommend paying for or using a script unless you fully trust its author and understand how it works. You may also find free, open-source alternatives in our community scripts.