OPEN-SOURCE SCRIPT
[Mycryptoradar] Triple EMA Strategie
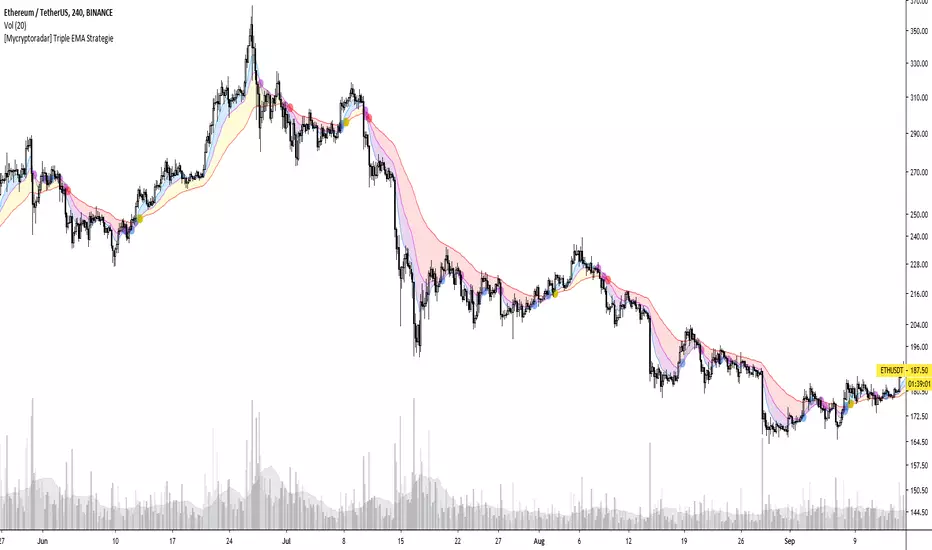
Triple EMA strategy consists of EMA 9, 21 & 55. A widely discussed trading strategy. If you want to know more about this strategy, enter the following search term at Google, "triple EMA 9, 21, 55 strategy".
How does this indicator work!
Background blue / yellow = bullish
Background red / purple = bearish
Every EMA crossover can be displayed on the chart (see circles)
Blue / blue / yellow circles = bullish
Purple / purple / red circles = bearish
Play with the settings and adjust them to your hand and don't forget to read about the EMA 9, 21, 55 strategy. Each background and crossover marking can be switched on and off separately.
This indicator visualizes the strategy and is not financial advice, you trade on your own findings. Has the indicator helped you with trading? Then leave a comment and like the indicator.
WANNA TIP ME? BUY ME SOME BEERS!
BTC: 3BMEXX5JrX94ziUSoQMLEmi51WcYwphAg3
ETH: 0x541e504bb461aa141de6ddce09dc89eb16f58f9c
LTC: LPBJXzUZJksCuCK27AY2qAVYGGGiUfejok
DON'T FORGET TO LOOK AT OUR SITE MYCRYPTORADAR
Open-source script
In true TradingView spirit, the creator of this script has made it open-source, so that traders can review and verify its functionality. Kudos to the author! While you can use it for free, remember that republishing the code is subject to our House Rules.
Disclaimer
The information and publications are not meant to be, and do not constitute, financial, investment, trading, or other types of advice or recommendations supplied or endorsed by TradingView. Read more in the Terms of Use.