OPEN-SOURCE SCRIPT
Updated Z-Score Bands + Signals
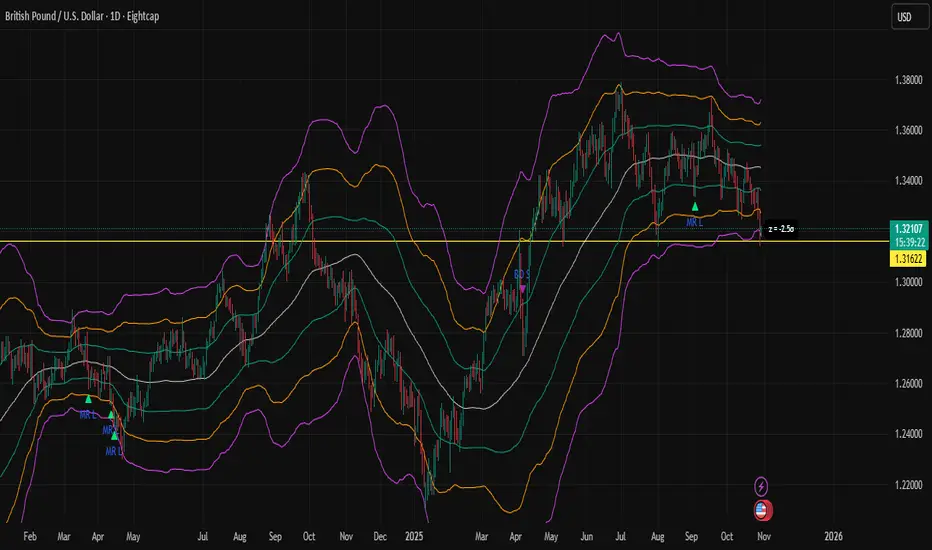
Z-Score Statistical Market Analyzer
A multi-dimensional market structure indicator based on standardized deviation & regime logic
English Description
Concept
This indicator builds a statistical model of price behaviour by converting every candle’s movement into a Z-score — how many standard deviations each close is away from its moving average.
It visualizes the normal distribution structure of returns and provides adaptive entry signals for both Mean Reversion and Breakout regimes.
Rather than predicting price direction, it measures statistical displacement from equilibrium and dynamically adjusts the decision logic according to the market’s volatility regime.
⚙️ Main Components
Z-Score Bands (±1σ, ±2σ, ±3σ)
– The core structure visualizes volatility boundaries based on rolling mean and standard deviation.
– Price outside ±2σ often indicates statistical extremes.
Dual Signal Systems
Mean Reversion (MRL / MRS): when price (or return z-score) crosses back inside ±2σ bands.
Breakout (BOL / BOS): when price continues to expand beyond ±2σ.
Volatility Regime Classification
The indicator detects whether the market is currently in a low-vol or high-vol regime using percentile statistics of σ.
Low vol → Mean Reversion preferred
High vol → Breakout preferred
🧠 Adaptive Switches
Each module can be toggled individually to test different statistical behaviours or tailor to a specific market condition.
📊 Interpretation
When the histogram of returns approximates a normal distribution, mean-reversion logic is often more effective.
When price persistently drifts beyond ±2σ or ±3σ, the distribution becomes leptokurtic (fat-tailed) — a breakout structure dominates.
Hence, this tool can help you:
Identify whether an asset behaves more “Gaussian” or “fat-tailed”;
Select the correct trading regime (MR or BO);
Quantitatively measure market tension and volatility clusters.
🧩 Recommended Use
Works on any timeframe and any asset.
Best used on liquid instruments (e.g., XAU/USD, indices, major FX pairs).
Combine with volume, sentiment or structural filters to confirm signals.
For strategy automation, pair with the companion script:
🧠 “Z-Score Strategy • Multi-Source Confirm (MRL/MRS/BOL/BOS)”.
⚠️ Disclaimer
This script is designed for educational and research purposes.
Statistical deviation ≠ directional prediction — use with sound risk management.
Past distribution patterns may shift under new volatility regimes.
==================================================================================
中文说明(简体)
概念简介
该指标基于价格的统计分布原理,将每根 K 线的波动转化为标准化的 Z-Score(标准差偏离值),用于刻画市场处于均衡或偏离状态。
它同时支持 均值回归(Mean Reversion) 与 突破延展(Breakout) 两种逻辑,并可根据市场波动结构自动切换策略模式。
⚙️ 主要功能模块
Z-Score 通道(±1σ / ±2σ / ±3σ)
用滚动均值与标准差动态绘制的统计波动带,价格超出 ±2σ 区域通常意味着极端偏离。
双信号系统
MRL / MRS(均值回归多空):价格重新回到 ±2σ 以内时触发。
BOL / BOS(突破延展多空):价格持续运行在 ±2σ 之外时触发。
波动率分层
自动识别市场处于高波动还是低波动区间:
低波动期 → 适合均值回归逻辑;
高波动期 → 适合突破趋势逻辑。
🧠 A–E 模块说明
A. 固定统计参数:使用上一根 K 线的均值和标准差,防止重绘。
B. 收盘确认信号:仅在当前时间框架收盘后生成信号,避免前视偏差。
C. 收益率信号模式:采用对数收益率的 Z-Score,更具普适性。
D. 异常波过滤:忽略单根极端波动(如 >20%)的噪声信号。
E. 波动率调节逻辑:根据市场处于高/低波动区间,自动切换 MRL/MRS 或 BOL/BOS。
📊 应用解读
如果收益率分布接近正态分布 → 市场倾向震荡,MRL/MRS 效果较佳;
若价格频繁偏离 ±2σ 或 ±3σ → 市场呈现“肥尾”分布,趋势延展占主导。
因此,该指标的核心目标是:
识别当前市场的统计结构类型;
根据波动特征自动切换交易逻辑;
提供结构化、可量化的市场状态刻画。
💡 使用建议
适用于所有时间框架与金融品种。
建议结合成交量或结构性指标过滤。
若用于策略回测,可搭配同名 “Z-Score Strategy • Multi-Source Confirm” 策略脚本。
⚠️ 免责声明
本指标仅用于研究与教学,不构成任何投资建议。
统计偏离 ≠ 趋势预测,实际市场行为可能在不同波动结构下改变。
A multi-dimensional market structure indicator based on standardized deviation & regime logic
English Description
Concept
This indicator builds a statistical model of price behaviour by converting every candle’s movement into a Z-score — how many standard deviations each close is away from its moving average.
It visualizes the normal distribution structure of returns and provides adaptive entry signals for both Mean Reversion and Breakout regimes.
Rather than predicting price direction, it measures statistical displacement from equilibrium and dynamically adjusts the decision logic according to the market’s volatility regime.
⚙️ Main Components
Z-Score Bands (±1σ, ±2σ, ±3σ)
– The core structure visualizes volatility boundaries based on rolling mean and standard deviation.
– Price outside ±2σ often indicates statistical extremes.
Dual Signal Systems
Mean Reversion (MRL / MRS): when price (or return z-score) crosses back inside ±2σ bands.
Breakout (BOL / BOS): when price continues to expand beyond ±2σ.
Volatility Regime Classification
The indicator detects whether the market is currently in a low-vol or high-vol regime using percentile statistics of σ.
Low vol → Mean Reversion preferred
High vol → Breakout preferred
🧠 Adaptive Switches
- A. Freeze MA/σ - Use previous-bar stats to avoid repainting and lag.
- B. Confirm on Close - Only generate signals once the base-timeframe bar closes (eliminates look-ahead bias).
- C. Return-based Signal - Use log-return Z-score instead of price deviation — normalizes volatility across assets.
- D. Outlier Filter - Exclude bars with abnormal single-bar returns (e.g., >20%). Reduces false spikes.
- E. Regime Gating - Automatically switch between Mean Reversion and Breakout logic depending on volatility percentile.
Each module can be toggled individually to test different statistical behaviours or tailor to a specific market condition.
📊 Interpretation
When the histogram of returns approximates a normal distribution, mean-reversion logic is often more effective.
When price persistently drifts beyond ±2σ or ±3σ, the distribution becomes leptokurtic (fat-tailed) — a breakout structure dominates.
Hence, this tool can help you:
Identify whether an asset behaves more “Gaussian” or “fat-tailed”;
Select the correct trading regime (MR or BO);
Quantitatively measure market tension and volatility clusters.
🧩 Recommended Use
Works on any timeframe and any asset.
Best used on liquid instruments (e.g., XAU/USD, indices, major FX pairs).
Combine with volume, sentiment or structural filters to confirm signals.
For strategy automation, pair with the companion script:
🧠 “Z-Score Strategy • Multi-Source Confirm (MRL/MRS/BOL/BOS)”.
⚠️ Disclaimer
This script is designed for educational and research purposes.
Statistical deviation ≠ directional prediction — use with sound risk management.
Past distribution patterns may shift under new volatility regimes.
==================================================================================
中文说明(简体)
概念简介
该指标基于价格的统计分布原理,将每根 K 线的波动转化为标准化的 Z-Score(标准差偏离值),用于刻画市场处于均衡或偏离状态。
它同时支持 均值回归(Mean Reversion) 与 突破延展(Breakout) 两种逻辑,并可根据市场波动结构自动切换策略模式。
⚙️ 主要功能模块
Z-Score 通道(±1σ / ±2σ / ±3σ)
用滚动均值与标准差动态绘制的统计波动带,价格超出 ±2σ 区域通常意味着极端偏离。
双信号系统
MRL / MRS(均值回归多空):价格重新回到 ±2σ 以内时触发。
BOL / BOS(突破延展多空):价格持续运行在 ±2σ 之外时触发。
波动率分层
自动识别市场处于高波动还是低波动区间:
低波动期 → 适合均值回归逻辑;
高波动期 → 适合突破趋势逻辑。
🧠 A–E 模块说明
A. 固定统计参数:使用上一根 K 线的均值和标准差,防止重绘。
B. 收盘确认信号:仅在当前时间框架收盘后生成信号,避免前视偏差。
C. 收益率信号模式:采用对数收益率的 Z-Score,更具普适性。
D. 异常波过滤:忽略单根极端波动(如 >20%)的噪声信号。
E. 波动率调节逻辑:根据市场处于高/低波动区间,自动切换 MRL/MRS 或 BOL/BOS。
📊 应用解读
如果收益率分布接近正态分布 → 市场倾向震荡,MRL/MRS 效果较佳;
若价格频繁偏离 ±2σ 或 ±3σ → 市场呈现“肥尾”分布,趋势延展占主导。
因此,该指标的核心目标是:
识别当前市场的统计结构类型;
根据波动特征自动切换交易逻辑;
提供结构化、可量化的市场状态刻画。
💡 使用建议
适用于所有时间框架与金融品种。
建议结合成交量或结构性指标过滤。
若用于策略回测,可搭配同名 “Z-Score Strategy • Multi-Source Confirm” 策略脚本。
⚠️ 免责声明
本指标仅用于研究与教学,不构成任何投资建议。
统计偏离 ≠ 趋势预测,实际市场行为可能在不同波动结构下改变。
Release Notes
English DescriptionZ-Score Bands + Signals • with Functional Switches
💡 Core Concept
This indicator is based on the Z-Score standardization principle from statistics.
It dynamically measures how far the current price deviates from its moving average, helping identify overbought/oversold zones and breakout momentum shifts.
By constructing adaptive standard-deviation bands (±1σ, ±2σ, ±3σ) and combining multiple control switches, it supports both Mean Reversion (MR) and Breakout (BO)-based trading approaches.
⚙️ Key Features
✅ Dynamic Z-Score Bands
- Computes moving average and volatility using either ta.sma() or EWMA (λ);
- Supports “frozen” mean and standard deviation (non-repainting mode).
✅ Signal Mode Selection
- Mean Reversion: price re-enters the ±2σ band after moving beyond it (reversal setup).
- Breakout: price closes outside ±2σ for two consecutive bars (trend confirmation).
- Both: displays both signal types simultaneously.
✅ Five Functional Switches (A–E)
- A: Freeze mean & stdev to avoid repainting
- B: Confirm signals only on bar close
- C: Use return-based z-score instead of price-based
- D: Filter outlier bars exceeding X% simple return
- E: Volatility regime gating: low-vol → MR, high-vol → BO
✅ Four Independent Signal Toggles
- Show MRL: Mean Reversion Long
- Show MRS: Mean Reversion Short
- Show BOL: Breakout Long
- Show BOS: Breakout Short
✅ Real-Time Z-Label
Displays the current z-score (in σ units) on the latest bar for quick visual reference.
✅ Built-In Alert Conditions
All signals are tied to alertcondition() for instant TradingView alerts or webhook integration.
📈 Strategy Application
- Sideways / Range-Bound Markets: use Mean Reversion mode (MRL/MRS work best).
- Trending / High-Volatility Phases: use Breakout mode (BOL/BOS more effective).
- Enable Regime Gating (E): automatically switch between MR and BO based on volatility percentile to reduce false signals.
Combine this indicator with volume, ATR, or volatility filters for more robust confirmations.
📊 Parameter Recommendations
Parameter Description Suggested Range
Lookback MA & Stdev calculation window 60–100 bars
σ1 / σ2 / σ3 Deviation thresholds 1 / 2 / 3
Return window Return-based z-score period ≈ Lookback
Outlier threshold Filter extreme bars 10–30%
Regime lookback Percentile window for volatility regime 252 bars (~1 year)
⚠️ Notes
- Designed for research and visualization, not financial advice.
- Smaller window lengths increase reactivity but may cause noise.
- Can be extended with strategy() for backtesting or automation.
- Works across multiple timeframes and asset classes.
🧩 Example Use Cases
1️⃣ Short-Term Mean Reversion:
Enter when price crosses back inside ±2σ; exit near mean or opposite band.
2️⃣ Breakout Confirmation:
Enter on sustained move beyond ±2σ during high-volatility regimes.
3️⃣ Hybrid Adaptive Mode:
Combine switch (E) for automatic regime transitions — MR in calm markets, BO during expansion phases.
==================================================================================
简体中文说明
Z-Score Bands + Signals • with Functional Switches
💡 核心概念
本指标基于统计学中的 Z-Score 标准化原理,用于动态监测价格的偏离程度,识别超买/超卖区间与突破趋势信号。通过价格的标准差带(±1σ, ±2σ, ±3σ)刻画出波动范围,并结合多层逻辑开关,支持均值回归(Mean Reversion)与突破(Breakout)两种交易思路。
⚙️ 功能特性
✅ Z-Score 动态带宽
使用 ta.sma() 或 EWMA(λ) 计算价格均值与波动范围;
支持冻结均值与标准差(避免重绘);
✅ 信号模式选择
Mean Reversion:价格从 ±2σ 之外回归带内(反转信号);
Breakout:价格连续两根收盘在 ±2σ 外(趋势信号);
Both:同时显示两类信号。
✅ 五大功能开关(A–E)
A:冻结均值与标准差(避免信号重绘)
B:仅在K线收盘时确认信号
C:使用收益率的Z值生成信号(避免价格尺度影响)
D:过滤异常波动
E:市场体制切换,低波动偏均值回归,高波动偏趋势突破
✅ 四类信号独立控制
- Show MRL:显示 Mean Reversion Long(均值回归多)
- Show MRS:显示 Mean Reversion Short(均值回归空)
- Show BOL:显示 Breakout Long(突破多)
- Show BOS:显示 Breakout Short(突破空)
可自由组合显示或仅关注单一信号类型。
✅ 实时 Z-Score 标签
在最新K线显示当前 z 值(标准差单位),帮助快速判断价格相对均值的位置。
✅ 内置提醒条件
所有信号均支持 alertcondition,可用于TradingView自动提醒或Webhook集成。
📈 策略应用建议
- 震荡市 / 区间波动期:选择 Mean Reversion 模式(MRL/MRS 有效)
- 单边趋势期 / 新闻驱动行情:选择 Breakout 模式(BOL/BOS 有效)
- 结合体制切换 E):在低波动区启用MR,高波动区自动切换BO,可减少错误信号。
- 建议配合成交量或波动率指标确认信号强度。
📊 参数建议
参数 说明 建议值
Lookback 计算均值与标准差的窗口 60–100
σ1, σ2, σ3 统计带宽阈值 默认 1 / 2 / 3
Return window 收益率Z分布窗口 与 Lookback 相近
Outlier threshold 异常波动过滤 10–30%
Regime lookback 波动率体制判定窗口 252(约一年)
⚠️注意事项
- 本指标为研究工具,不构成交易建议。
- 参数过小可能导致过度拟合,建议结合长期历史数据校验。
- 可结合 strategy() 函数编写回测脚本评估信号表现。
==================================================================================
繁體中文版本
Z-Score Bands + Signals • with Functional Switches(Z值通道與訊號控制)
💡 核心概念
此指標以統計學的 Z值(標準差分位) 為基礎,用於衡量價格偏離均值的程度,協助辨識超買/超賣區域與趨勢突破信號。
透過動態標準差通道(±1σ、±2σ、±3σ),可即時觀察市場結構,並以多重功能開關支援**均值回歸(Mean Reversion)及趨勢突破(Breakout)**兩種策略邏輯。
⚙️ 功能特性
✅ 動態標準差通道
可選用 ta.sma() 或 EWMA(λ) 計算波動範圍;
支援「凍結」均值與標準差,避免重繪現象。
✅ 信號模式選擇
Mean Reversion(均值回歸):價格由 ±2σ 外返回通道內。
Breakout(趨勢突破):價格連續兩根收盤維持於 ±2σ 之外。
Both:同時顯示兩類信號。
✅ 五項功能開關(A–E)
- A:凍結均值與標準差(避免信號重繪)
- B:僅於收盤時確認信號
- C:使用報酬率Z值生成信號(避免價格基數影響)
- D:過濾異常波動(>
- E:市場體制切換:低波動啟用MR,高波動啟用BO
✅ 四類信號獨立開關
- Show MRL:顯示均值回歸做多
- Show MRS:顯示均值回歸做空
- Show BOL:顯示突破做多
- Show BOS:顯示突破做空
可自由選擇要顯示的信號類型,亦可全部開啟同時觀察。
✅ 即時 Z值標籤
於圖表右側顯示目前價格的 Z 值(以標準差為單位),便於判斷當前價格偏離均值的程度。
✅ 提醒條件
每個信號皆支援 alertcondition,可配合 TradingView 警報或自動化策略使用。
📈 策略建議
- 盤整/震盪行情:使用 Mean Reversion 模式(MRL/MRS 效果佳)
- 趨勢明確/高波動時期:使用 Breakout 模式(BOL/BOS 有效)
- 啟用 E) 市場體制切換:在低波動區間啟用 MR,在高波動階段切換至 BO,可顯著降低假信號。
📊 參數建議
參數 說明 建議值
Lookback 均值與標準差計算區間 60–100
σ1, σ2, σ3 通道寬度 預設 1 / 2 / 3
Return window 報酬率Z值計算區間 約等於 Lookback
Outlier threshold 異常波動過濾門檻 10–30%
Regime lookback 波動體制計算週期 252 根(約一年)
⚠️ 注意事項
- 此指標僅供教育與研究用途,不構成投資建議。
- 建議搭配歷史資料或模擬回測進行驗證。
- 參數過小可能導致過度靈敏或信號雜訊過多。
Open-source script
In true TradingView spirit, the creator of this script has made it open-source, so that traders can review and verify its functionality. Kudos to the author! While you can use it for free, remember that republishing the code is subject to our House Rules.
Disclaimer
The information and publications are not meant to be, and do not constitute, financial, investment, trading, or other types of advice or recommendations supplied or endorsed by TradingView. Read more in the Terms of Use.