OPEN-SOURCE SCRIPT
Updated Previous Day OHLC Dashboard (Last N Days)
Indicator: Previous Day OHLC Dashboard (Multi-Day)
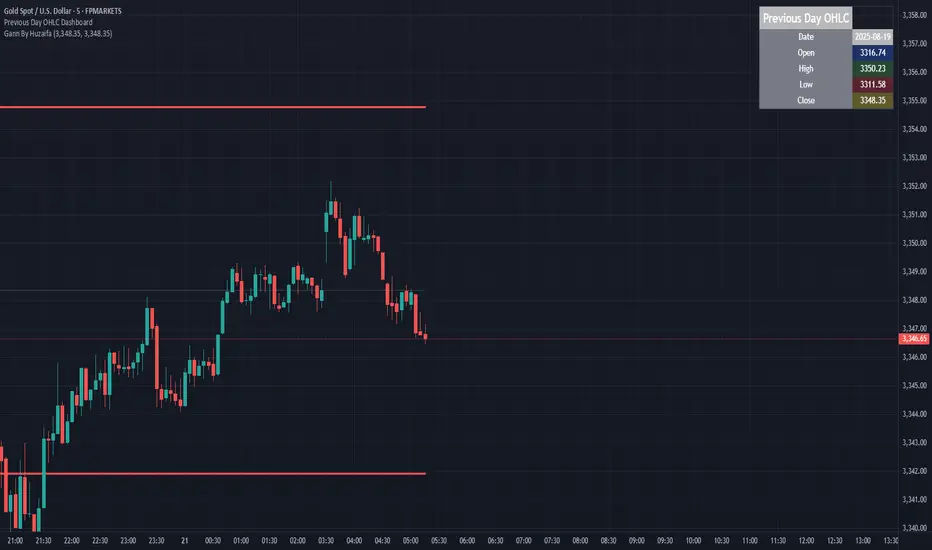
This indicator displays a dashboard-style table on your chart that shows the Open, High, Low, and Close (OHLC) of the previous trading days. It’s designed to help traders quickly reference key daily levels that often act as important support and resistance zones.
🔑 Features:
Dashboard Table: Shows OHLC data for the last N trading days (default = 3, up to 10).
Customizable Appearance:
Change the position of the dashboard (Top-Right, Top-Left, Bottom-Right, Bottom-Left).
Adjust text size (Tiny → Huge).
Customize colors for header, labels, and each OHLC column.
Yesterday’s OHLC Lines (optional): Plots horizontal lines on the chart for the previous day’s Open, High, Low, and Close.
Intraday & Multi-Timeframe Compatible: Works on all timeframes below Daily — values update automatically from the daily chart.
📊 Use Cases:
Quickly identify yesterday’s key levels for intraday trading.
Track how current price reacts to previous day’s support/resistance.
Keep a multi-day reference for trend bias and range context.
⚙️ How it Works:
The indicator pulls daily OHLC values using request.security() with lookahead_on to ensure prior day’s values are extended across the next session.
These values are displayed in a compact table for quick reference.
Optionally, the most recent daily levels (D-1) are plotted as chart lines.
✅ Perfect for day traders, scalpers, and swing traders who rely on yesterday’s price action to plan today’s trades.
Release Notes
📌 Indicator: Previous Day OHLC DashboardThis indicator creates a compact dashboard on your chart showing the Open, High, Low, and Close (OHLC) values from the previous trading day, along with the date. It provides a quick, always-visible reference to the prior day’s key price levels, which often act as important support and resistance zones.
🔑 Features:
Previous Day OHLC Values: Displays yesterday’s Open, High, Low, and Close in an easy-to-read table.
Date Display: Shows the exact date (YYYY-MM-DD) of the previous trading session.
Customizable Colors:
Change the dashboard’s background, header, and text colors.
Customize the cell colors for Open, High, Low, and Close values.
Clear Layout: Default position is Top-Right of the chart for easy visibility (lightweight, does not clutter price action).
📊 Use Cases:
Intraday traders can instantly reference yesterday’s levels for support/resistance.
Swing traders can keep track of how current price interacts with prior daily key levels.
Works on all intraday and higher timeframes.
⚙️ How It Works:
Uses the previous day’s daily OHLC values and date.
Displays them in a simple dashboard table on the chart.
Values update automatically with each new trading session.
✅ This tool is especially useful for day traders, scalpers, and price action traders who want to keep yesterday’s key levels front and center without drawing extra lines on the chart.
Open-source script
In true TradingView spirit, the creator of this script has made it open-source, so that traders can review and verify its functionality. Kudos to the author! While you can use it for free, remember that republishing the code is subject to our House Rules.
Disclaimer
The information and publications are not meant to be, and do not constitute, financial, investment, trading, or other types of advice or recommendations supplied or endorsed by TradingView. Read more in the Terms of Use.