OPEN-SOURCE SCRIPT
Updated ATR Stop Buffer
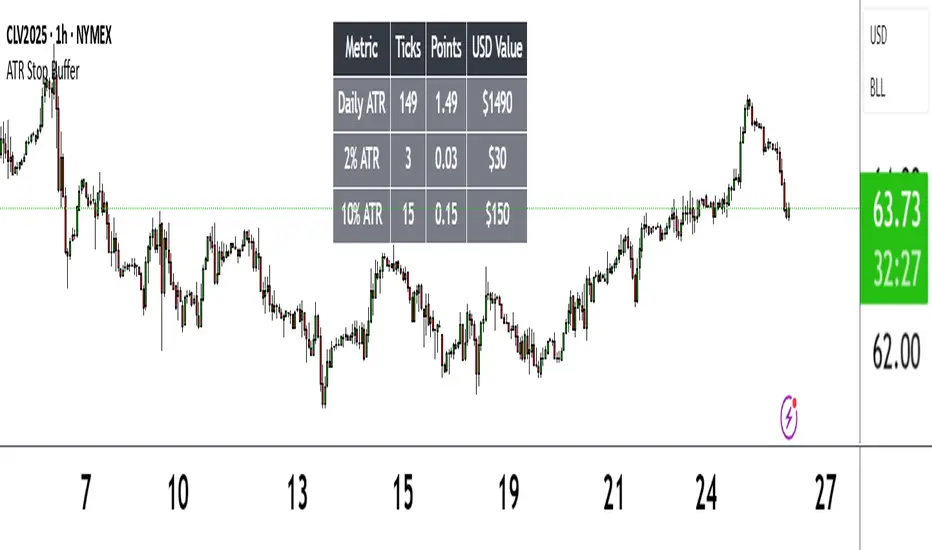
The ATR Stop Buffer indicator calculates the Daily Average True Range (ATR) and converts it into ticks based on the symbol's minimum price movement. It then displays the full ATR, 2% of ATR, and 10% of ATR in a clean table format, rounded up for simplicity. This tool is ideal for traders who want to set volatility-based stop-loss levels or buffers for their trades.
Key Features:
- Uses a 14-period Daily ATR for robust volatility measurement.
- Converts ATR into ticks for precise application across different instruments.
- Table display with toggle option for flexibility.
- Perfect for risk management and trade planning.
How to Use:
1. Add the indicator to your chart.
2. Use the table values to adjust your stop-loss distances (e.g., 2% ATR for tight stops, 10% ATR for wider buffers).
3. Toggle the table off if you only need the values occasionally.
Note: Works best on instruments with defined tick sizes (e.g., futures, forex, stocks).
Release Notes
ATR Stop Buffer displays the Daily Average True Range (ATR) and customizable percentage values in ticks, points, and USD, shown in a table. Helps traders set volatility-based stop-loss buffers.Features:
Calculates 14-period Daily ATR in ticks and points using the symbol's tick size.
Shows customizable ATR percentages (default: 2% and 10%) for stop-loss sizing.
Displays USD values for ATR and percentages, based on symbol data.
Customizable table with options for position, colors, font size, and row visibility.
How to Use:
Add to chart and adjust "Display Options" to customize table settings and percentages.
Use table values (ticks, points, USD) for stop-loss or buffer levels.
Notes:
Best for daily charts or lower timeframes using daily ATR.
USD calculations rely on symbol data; verify asset compatibility.
Toggle percentage rows to simplify display if needed.
Open-source script
In true TradingView spirit, the creator of this script has made it open-source, so that traders can review and verify its functionality. Kudos to the author! While you can use it for free, remember that republishing the code is subject to our House Rules.
Disclaimer
The information and publications are not meant to be, and do not constitute, financial, investment, trading, or other types of advice or recommendations supplied or endorsed by TradingView. Read more in the Terms of Use.